


Search 12,100+ Infographics!

Most Popular College Degrees Ranked by ROI After 5 Years in Workforce
With the average cost of college now exceeding $43,000 per year, students face difficult questions long before entering the workforce. Will a specific degree lead to strong career opportunities? Will the salary justify the cost of tuition? How long will it take to see a meaningful return on that investment?
Going the Distance: The Highest-Mileage Cars Ever Reported
A well-maintained modern vehicle is capable of reaching upwards of 200,000 miles with proper care and maintenance. However, there are a select few that defy the ravages of standard wear and tear, logging distances that stretch into the millions. CarGurus decided to do some research on extreme car mileage to get a better picture of what keeps these automotive legends running.

The World’s Most Incredible Libraries You Can Still Visit
Explore some of the most remarkable libraries still standing today, places where history, architecture, and culture come together in ways you can actually experience in person. In these spaces, priceless manuscripts, national treasures, and centuries of knowledge are still preserved, and the architecture can be just as breathtaking as the collections inside.

Cybersecurity For Small Business: What You Actually Need
Ask a six-person shop owner what they need for cybersecurity, and they’ll tell you they’re not sure because at least four different vendors have pitched them an expensive cybersecurity operations center. A new graphic from Ooma reassures these business owners that they really do not need a SOC.

How Have the Top 25 Most Popular College Majors Changed Over Time?
Choosing a college major is one of the big decisions a student will make in their lifetime. That decision will affect which schools they apply to, their career prospects, income, and potentially even where they’ll live. Student Choice have updated their rankings of college major popularity in their new 2026 study. The results held some surprises.

Anatomy of a Modern Web Page: How 40% Content Became 100% Distraction
Modern web pages have become increasingly bloated. Here is a visual analysis that examines how today’s websites allocate bandwidth and screen space, the impact that clutter has on usability, cognitive load, and accessibility, and why a cleaner, content-first browsing experience helps users find information faster and with fewer distractions.

A Solution to the Nursing Shortage
By 2030, the world is set to have a 4.5 million nursing shortage, but maybe the solution doesn’t have to be to find more nurses. Check out the following infographic from Swisslog that seeks to solve the nursing shortage with innovative technology.

Understanding the Tri-Merge Standard in Mortgage Credit Lending
What exactly is the tri-merge standard? Utilizing the median of 3 credit scores shows a fuller picture on what would otherwise fall through the cracks in credit score discrepancies. See more in the infographic below, courtesy Equifax.
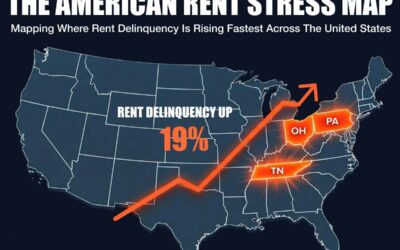
Mapping Where Rent Delinquency Is Rising Fastest Across the U.S.
This infographic illustrates the sharp increase in U.S. rent delinquency rates, which rose from 9.33% in January 2026 to a peak of 11.09% by May 2026. It highlights a “Dual-Stress Corridor” across the Southeast and Rust Belt, where lower-cost states like West Virginia, Tennessee, and Mississippi face the highest delinquency rates, despite their relatively affordable average rents.
The Attention Economy: Where Your Time Actually Goes
This infographic from the team at Ooma explores how the modern “attention economy” consumes our daily time by analyzing where our focus is directed amidst constant digital stimulation. It breaks down how different screen activities and social media platforms compete for our limited attention.
Most Popular College Degrees Ranked by ROI After 5 Years in Workforce
With the average cost of college now exceeding $43,000 per year, students face difficult questions long before entering the workforce. Will a specific degree lead to strong career opportunities? Will the salary justify the cost of tuition? How long will it take to see a meaningful return on that investment?
Going the Distance: The Highest-Mileage Cars Ever Reported
A well-maintained modern vehicle is capable of reaching upwards of 200,000 miles with proper care and maintenance. However, there are a select few that defy the ravages of standard wear and tear, logging distances that stretch into the millions. CarGurus decided to do some research on extreme car mileage to get a better picture of what keeps these automotive legends running.
The World’s Most Incredible Libraries You Can Still Visit
Explore some of the most remarkable libraries still standing today, places where history, architecture, and culture come together in ways you can actually experience in person. In these spaces, priceless manuscripts, national treasures, and centuries of knowledge are still preserved, and the architecture can be just as breathtaking as the collections inside.
Cybersecurity For Small Business: What You Actually Need
Ask a six-person shop owner what they need for cybersecurity, and they’ll tell you they’re not sure because at least four different vendors have pitched them an expensive cybersecurity operations center. A new graphic from Ooma reassures these business owners that they really do not need a SOC.
How Have the Top 25 Most Popular College Majors Changed Over Time?
Choosing a college major is one of the big decisions a student will make in their lifetime. That decision will affect which schools they apply to, their career prospects, income, and potentially even where they’ll live. Student Choice have updated their rankings of college major popularity in their new 2026 study. The results held some surprises.
Anatomy of a Modern Web Page: How 40% Content Became 100% Distraction
Modern web pages have become increasingly bloated. Here is a visual analysis that examines how today’s websites allocate bandwidth and screen space, the impact that clutter has on usability, cognitive load, and accessibility, and why a cleaner, content-first browsing experience helps users find information faster and with fewer distractions.
A Solution to the Nursing Shortage
By 2030, the world is set to have a 4.5 million nursing shortage, but maybe the solution doesn’t have to be to find more nurses. Check out the following infographic from Swisslog that seeks to solve the nursing shortage with innovative technology.
Understanding the Tri-Merge Standard in Mortgage Credit Lending
What exactly is the tri-merge standard? Utilizing the median of 3 credit scores shows a fuller picture on what would otherwise fall through the cracks in credit score discrepancies. See more in the infographic below, courtesy Equifax.
Mapping Where Rent Delinquency Is Rising Fastest Across the U.S.
This infographic illustrates the sharp increase in U.S. rent delinquency rates, which rose from 9.33% in January 2026 to a peak of 11.09% by May 2026. It highlights a “Dual-Stress Corridor” across the Southeast and Rust Belt, where lower-cost states like West Virginia, Tennessee, and Mississippi face the highest delinquency rates, despite their relatively affordable average rents.
The Attention Economy: Where Your Time Actually Goes
This infographic from the team at Ooma explores how the modern “attention economy” consumes our daily time by analyzing where our focus is directed amidst constant digital stimulation. It breaks down how different screen activities and social media platforms compete for our limited attention.
Partners


Browse Archives By Category
Animated Infographics
Business Infographics
Career & Jobs Infographics
Education Infographics
Entertainment Industry Infographics
Environmental Infographics
Finance & Money Infographics
Food & Drink Infographics
Health Infographics
Historical Infographics
Home & Garden Infographics
Internet Infographics
Law and Legal Infographics
Lifestyle Infographics
Marketing Infographics
Offbeat Infographics
Parenting Infographics
Pets & Animals Infographics
Political Infographics
Shopping Infographics
Sports and Athletic Infographics
Technology Infographics
Transportation Infographics
Travel Infographics
Video Infographics