Career & Jobs Infographics
The Future of Work: Automation and the Skills Gap
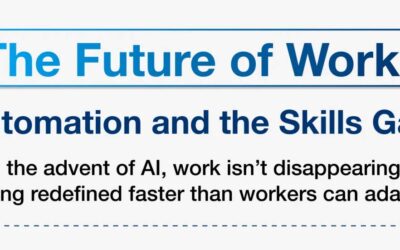
This infographic courtesy of Qualtrics details how AI and automation are fundamentally reshaping the global labor market, projected to displace 92 million jobs while creating 170 million new ones worldwide by 2030. This transformation places a premium on unique human capabilities like analytical thinking and creativity.
In Which Countries Do People Believe AI Will Improve Work Life?
Companies that operate across borders should be aware that AI sentiment among the workforce can shift dramatically from country to country, as this new Qualtrics survey shows. Worker feelings are an important consideration when rolling out new AI tools, and a change that works well in Jakarta or Mexico City might face stronger opposition in Toronto or London.

Where in the United States Are People the Most Eager to Get a Job?
Seeking employment can be a difficult pursuit, with average searches lasting nearly six months. A new Qualtrics survey pinpoints the areas of the U.S. where the most job-searching activity was logged. If you’re searching in Alaska, Idaho, or California, you’ll have plenty of company. These states had the most job-seeking activity.

Unemployment Rates Around the World
Qualtrics released a map that provides important insight into the world economy. It displays the unemployment rates in every country in the world. Their findings reveal that the country with the healthiest job market is Qatar, with a worldwide-low unemployment rate of .13%. Qatar’s impressive unemployment rate is likely due to its thriving economy, rich in petroleum and natural gas, which employs a large number of people.
What Percentage of the Workforce Has Been Self-Employed Over Time?
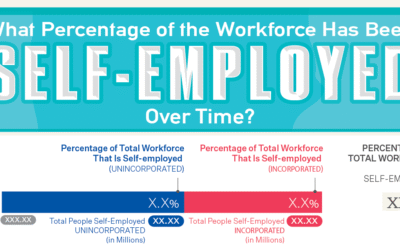
Technology has transformed the self-employed workforce in America, creating new roles and new fields of work alongside revolutionizing the way people work in traditional careers. The Ooma team examined the rates of self-employment over time, including gig work on platforms like DoorDash, Uber, and Instacart.
Which Industries Employ the Most Customer Service Representatives?
In 2022, nearly 3 million Americans worked as customer service representatives. The team at Qualtrics took a closer look at this role with a study examining which industries hire the most customer service reps. This job can entail a wide range of tasks and expectations, but there is no doubt that they’re integral to the success of many businesses.
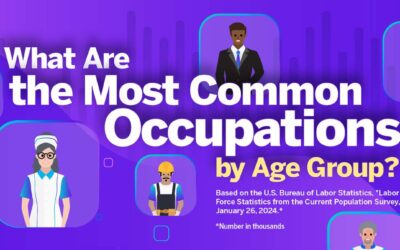
What Are the Most Common Occupations by Age Group?
The team at Qualtrics gathered data from the U.S. Bureau of Labor Statistics to discover the most common jobs by age group. The results can show us how experience, education, and life’s changing needs shift workers’ priorities over time, with data showing us plenty of fascinating insights about the American workforce.

Where in the U.S. Have People Spent the Highest Percentage of Their Past Year Working?
The team at Qualtrics released a new map illustrating the percentage of time residents in each state spent working over the past year. A color-coding scale shows that all states with sufficient data spent between 16% and 27% of their time working.

30 Self-Employment Statistics
Self-employment is an alternative career path that offers its own benefits and complications. Here are thirty facts and statistics about self-employment reveal the prevalence of this work style, its unique benefits and challenges, and the attitudes of workers toward self-employment.
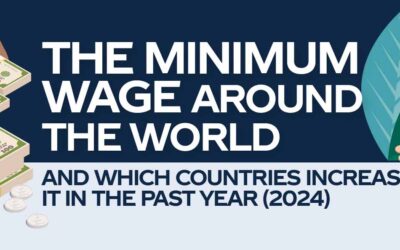
Minimum Wage Around the World and Which Countries Increased It in 2024
A new study from Madison Trust Company shows the countries with the highest minimum wages and the most considerable minimum wage increases in recent years. Studies show that the countries with a higher minimum wage requirement have happier citizens.
The Future of Work: Automation and the Skills Gap
This infographic courtesy of Qualtrics details how AI and automation are fundamentally reshaping the global labor market, projected to displace 92 million jobs while creating 170 million new ones worldwide by 2030. This transformation places a premium on unique human capabilities like analytical thinking and creativity.
In Which Countries Do People Believe AI Will Improve Work Life?
Companies that operate across borders should be aware that AI sentiment among the workforce can shift dramatically from country to country, as this new Qualtrics survey shows. Worker feelings are an important consideration when rolling out new AI tools, and a change that works well in Jakarta or Mexico City might face stronger opposition in Toronto or London.
Where in the United States Are People the Most Eager to Get a Job?
Seeking employment can be a difficult pursuit, with average searches lasting nearly six months. A new Qualtrics survey pinpoints the areas of the U.S. where the most job-searching activity was logged. If you’re searching in Alaska, Idaho, or California, you’ll have plenty of company. These states had the most job-seeking activity.
Unemployment Rates Around the World
Qualtrics released a map that provides important insight into the world economy. It displays the unemployment rates in every country in the world. Their findings reveal that the country with the healthiest job market is Qatar, with a worldwide-low unemployment rate of .13%. Qatar’s impressive unemployment rate is likely due to its thriving economy, rich in petroleum and natural gas, which employs a large number of people.
What Percentage of the Workforce Has Been Self-Employed Over Time?
Technology has transformed the self-employed workforce in America, creating new roles and new fields of work alongside revolutionizing the way people work in traditional careers. The Ooma team examined the rates of self-employment over time, including gig work on platforms like DoorDash, Uber, and Instacart.
Which Industries Employ the Most Customer Service Representatives?
In 2022, nearly 3 million Americans worked as customer service representatives. The team at Qualtrics took a closer look at this role with a study examining which industries hire the most customer service reps. This job can entail a wide range of tasks and expectations, but there is no doubt that they’re integral to the success of many businesses.
What Are the Most Common Occupations by Age Group?
The team at Qualtrics gathered data from the U.S. Bureau of Labor Statistics to discover the most common jobs by age group. The results can show us how experience, education, and life’s changing needs shift workers’ priorities over time, with data showing us plenty of fascinating insights about the American workforce.
Where in the U.S. Have People Spent the Highest Percentage of Their Past Year Working?
The team at Qualtrics released a new map illustrating the percentage of time residents in each state spent working over the past year. A color-coding scale shows that all states with sufficient data spent between 16% and 27% of their time working.
30 Self-Employment Statistics
Self-employment is an alternative career path that offers its own benefits and complications. Here are thirty facts and statistics about self-employment reveal the prevalence of this work style, its unique benefits and challenges, and the attitudes of workers toward self-employment.
Minimum Wage Around the World and Which Countries Increased It in 2024
A new study from Madison Trust Company shows the countries with the highest minimum wages and the most considerable minimum wage increases in recent years. Studies show that the countries with a higher minimum wage requirement have happier citizens.
Search 12,100+ Infographics!
Partners


Browse Archives By Category
Animated Infographics
Business Infographics
Career & Jobs Infographics
Education Infographics
Entertainment Industry Infographics
Environmental Infographics
Finance & Money Infographics
Food & Drink Infographics
Health Infographics
Historical Infographics
Home & Garden Infographics
Internet Infographics
Law and Legal Infographics
Lifestyle Infographics
Marketing Infographics
Offbeat Infographics
Parenting Infographics
Pets & Animals Infographics
Political Infographics
Shopping Infographics
Sports and Athletic Infographics
Technology Infographics
Transportation Infographics
Travel Infographics
Video Infographics