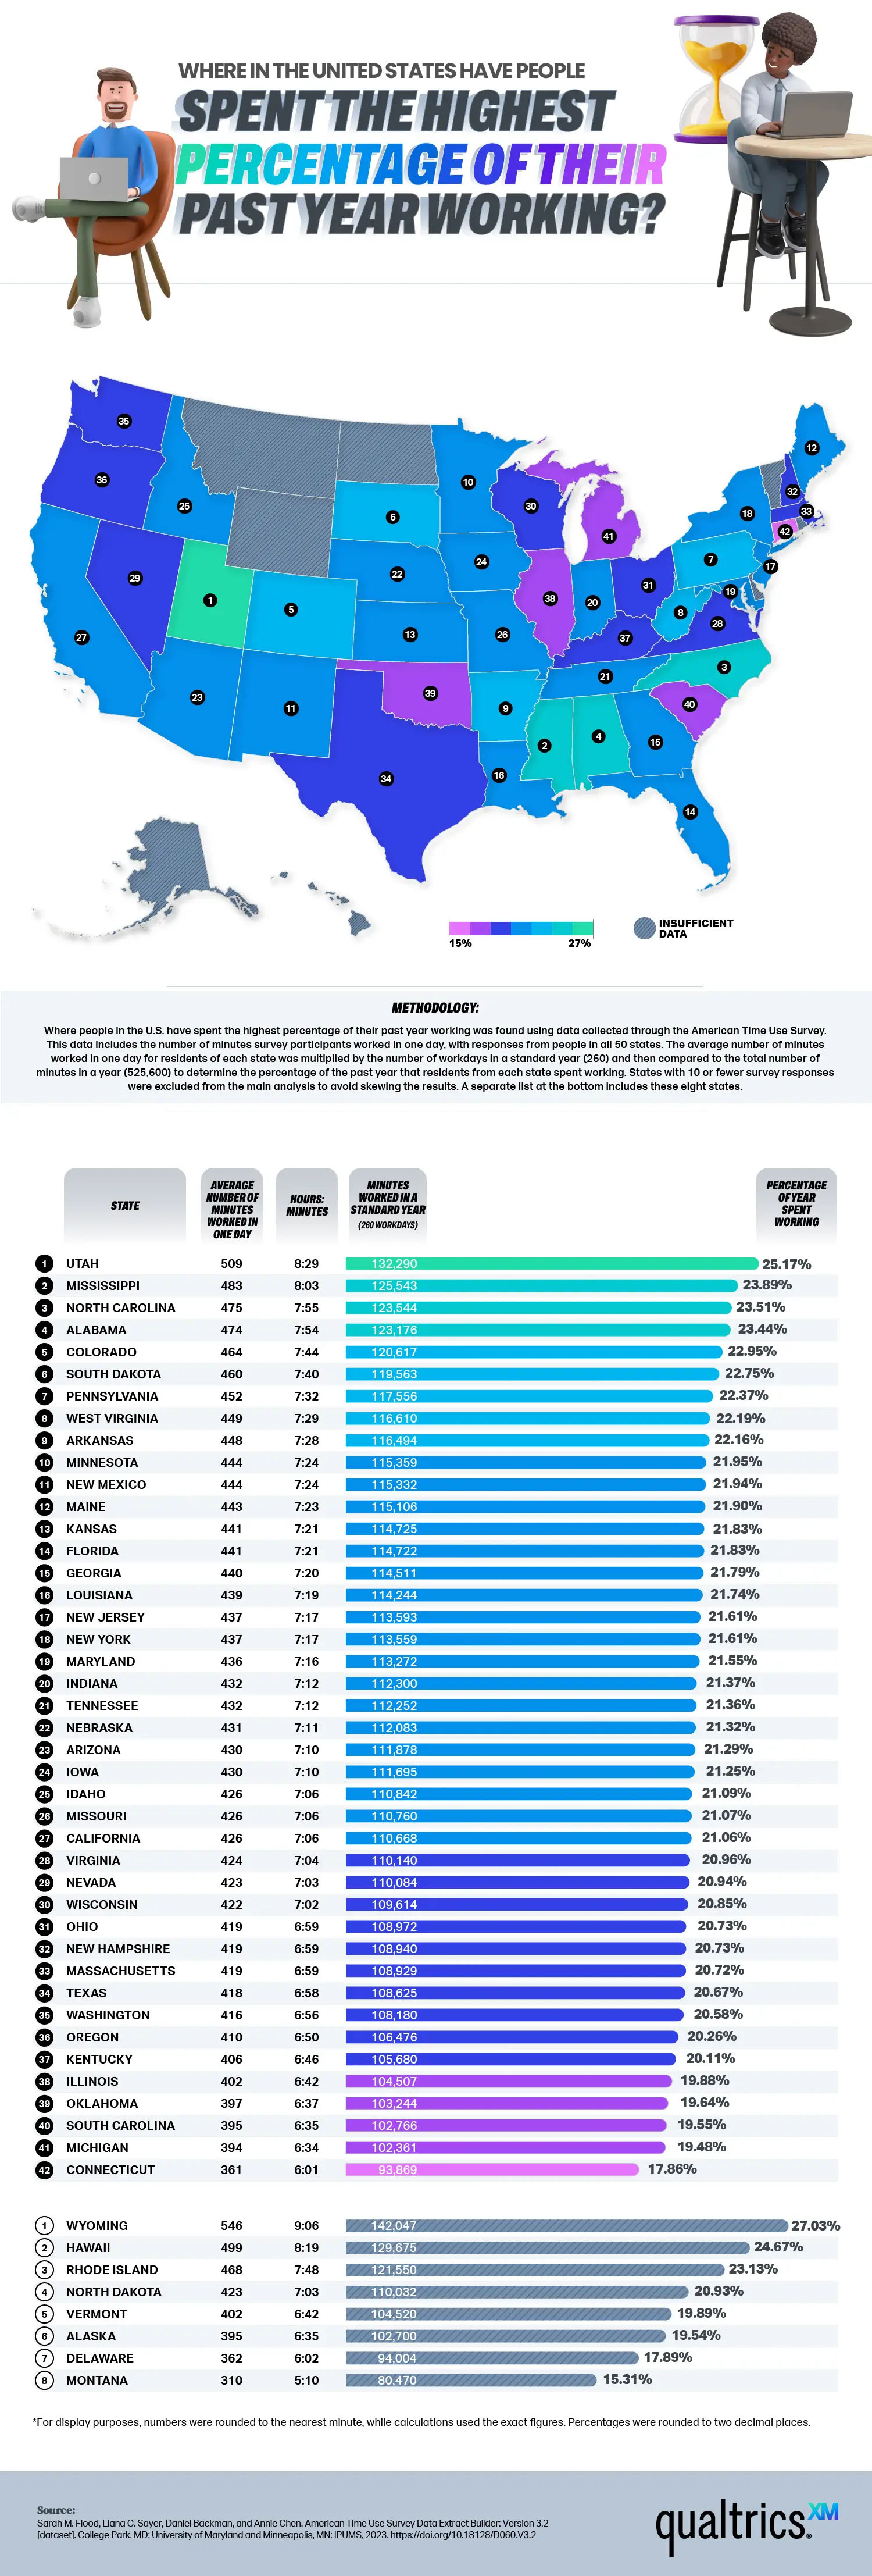
The team at Qualtrics released a new map illustrating the percentage of time residents in each state spent working over the past year. A color-coding scale shows that all states with sufficient data spent between 16% and 27% of their time working.
It’s important to note that a few states didn’t have sufficient data to rank properly. These included Wyoming, Hawaii, Rhode Island, North Dakota, Vermont, Alaska, Delaware, and Montana.
[Click here for full size version]
Irma Wallace
Co-founder and Vice President of SearchRank, responsible for many of the day to day operations of the company. She is also founder of The Arizona Builders' Zone, a construction / home improvement portal.


