Business Infographics

Seven Reasons Your Commercial Facility Roof is So Expensive
Afraid your next roof replacement will come sooner or is going to cost more than you expect? You’re probably right. There are seven major reasons why commercial facility roofs are more expensive than a typical roof. In this infographic, we do a deep dive into all seven reasons, courtesy of Kato Roofing.
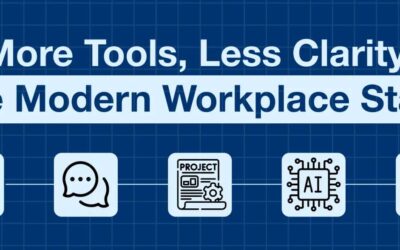
More Tools, Less Clarity: The Modern Workplace Stack
Here is an infographic that explains the modern workplace has more apps, more platforms and more tools… but not always more clarity. The modern workplace tech stack keeps growing, and for many employees, navigating it has become a job in itself. The data reveals how workplace technology is really affecting the way we work.
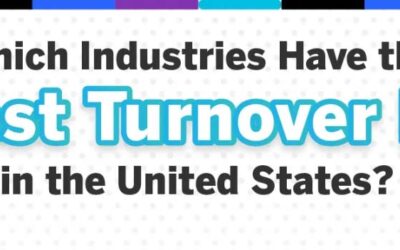
Which Industries Have the Highest Turnover Rates in the United States?
Turnover rates are a signal of a business’s and the industry’s overall health, as this Qualtrics study demonstrates. High turnover forces companies to spend more on recruiting, hiring, and training, so business leaders and HR professionals should pay attention to turnover trends.

Top 10 Tips For Succession Planning
Here is a useful infographic from the folks at Law Mergers & Acquisitions in the UK that offers 10 essential tips for succession planning which is the strategic, proactive process of identifying and developing internal employees to fill key leadership and business-critical roles when current holders leave, retire, or pass away.

e-Commerce Brands With Highest Earnings and Biggest Losses Over the Past Year
E-commerce is a booming industry full of competition and the possibility for extreme gains and painful losses. The team at LLCAttorney shows just how devastating these losses can be with a chart showing the companies with the biggest gains and losses in 2025.
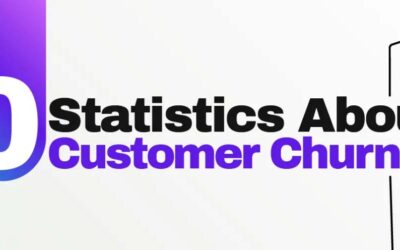
30 Statistics About Customer Churn
Customer churn is a figure calculated that shows how many customers don’t return to a business over time. Strong customer loyalty is an invaluable asset to businesses across industries. The team at Qualtrics helps us understand customer churn across its many facets, using a chart that displays 30 key statistics.
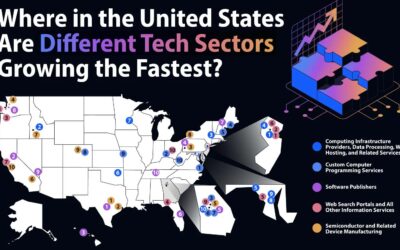
Where in the United States Are Different Tech Sectors Growing the Fastest?
Silicon Valley reigns supreme as the capital of technological progress, and with four of its companies valued in the trillions, its reputation won’t fade anytime soon. But a look at the broader technology landscape reveals that tech isn’t centered in the valley alone. Research from Pulse charts where different sectors of the tech industry are carving out their own space.

Where the Side-Gig Economy Is Growing the Fastest in the U.S.
A new study from LLC Attorney determined where in the U.S. the side-gig economy grew the most and presented evidence for why this micro-economy is booming. The team studied how many people in each state got a second job, as well as the number of non-employer businesses established in 2022 and 2023.
Products and Services That Revolutionized Entire Industries
A world of products has transformed entire industries and shaped our everyday lives, especially with the technological advances of the past few decades. The team at Qualtrics celebrated these technologies with a timeline showing the most influential products and services. From 1981 to 2022, we have seen numerous examples of revolutionary products and technologies.

What Keeping Up With Energy Demand Means to the Power Grid
America’s power demand is surging, but our aging grid can’t keep up. To meet the future, we need smarter, more resilient infrastructure—starting with transformers built here in the United States. Learn more about how what keeping up with energy demand means to the power grid in the following infographic, courtesy of ELSCO.
Seven Reasons Your Commercial Facility Roof is So Expensive
Afraid your next roof replacement will come sooner or is going to cost more than you expect? You’re probably right. There are seven major reasons why commercial facility roofs are more expensive than a typical roof. In this infographic, we do a deep dive into all seven reasons, courtesy of Kato Roofing.
More Tools, Less Clarity: The Modern Workplace Stack
Here is an infographic that explains the modern workplace has more apps, more platforms and more tools… but not always more clarity. The modern workplace tech stack keeps growing, and for many employees, navigating it has become a job in itself. The data reveals how workplace technology is really affecting the way we work.
Which Industries Have the Highest Turnover Rates in the United States?
Turnover rates are a signal of a business’s and the industry’s overall health, as this Qualtrics study demonstrates. High turnover forces companies to spend more on recruiting, hiring, and training, so business leaders and HR professionals should pay attention to turnover trends.
Top 10 Tips For Succession Planning
Here is a useful infographic from the folks at Law Mergers & Acquisitions in the UK that offers 10 essential tips for succession planning which is the strategic, proactive process of identifying and developing internal employees to fill key leadership and business-critical roles when current holders leave, retire, or pass away.
e-Commerce Brands With Highest Earnings and Biggest Losses Over the Past Year
E-commerce is a booming industry full of competition and the possibility for extreme gains and painful losses. The team at LLCAttorney shows just how devastating these losses can be with a chart showing the companies with the biggest gains and losses in 2025.
30 Statistics About Customer Churn
Customer churn is a figure calculated that shows how many customers don’t return to a business over time. Strong customer loyalty is an invaluable asset to businesses across industries. The team at Qualtrics helps us understand customer churn across its many facets, using a chart that displays 30 key statistics.
Where in the United States Are Different Tech Sectors Growing the Fastest?
Silicon Valley reigns supreme as the capital of technological progress, and with four of its companies valued in the trillions, its reputation won’t fade anytime soon. But a look at the broader technology landscape reveals that tech isn’t centered in the valley alone. Research from Pulse charts where different sectors of the tech industry are carving out their own space.
Where the Side-Gig Economy Is Growing the Fastest in the U.S.
A new study from LLC Attorney determined where in the U.S. the side-gig economy grew the most and presented evidence for why this micro-economy is booming. The team studied how many people in each state got a second job, as well as the number of non-employer businesses established in 2022 and 2023.
Products and Services That Revolutionized Entire Industries
A world of products has transformed entire industries and shaped our everyday lives, especially with the technological advances of the past few decades. The team at Qualtrics celebrated these technologies with a timeline showing the most influential products and services. From 1981 to 2022, we have seen numerous examples of revolutionary products and technologies.
What Keeping Up With Energy Demand Means to the Power Grid
America’s power demand is surging, but our aging grid can’t keep up. To meet the future, we need smarter, more resilient infrastructure—starting with transformers built here in the United States. Learn more about how what keeping up with energy demand means to the power grid in the following infographic, courtesy of ELSCO.
Search 12,100+ Infographics!
Partners


Browse Archives By Category
Animated Infographics
Business Infographics
Career & Jobs Infographics
Education Infographics
Entertainment Industry Infographics
Environmental Infographics
Finance & Money Infographics
Food & Drink Infographics
Health Infographics
Historical Infographics
Home & Garden Infographics
Internet Infographics
Law and Legal Infographics
Lifestyle Infographics
Marketing Infographics
Offbeat Infographics
Parenting Infographics
Pets & Animals Infographics
Political Infographics
Shopping Infographics
Sports and Athletic Infographics
Technology Infographics
Transportation Infographics
Travel Infographics
Video Infographics