Business Infographics

The Small Business Landscape
Small businesses make up 80% of the total number of businesses in the U.S. today. And for their owners, today’s economic environment presents a unique set of challenges and opportunities to build their business. Signs.com explores some of the pitfalls, plans and perspectives of current business owners to get an idea of how they succeed.

Sensible Tweet Chat Checklist for Businesses
Hosting a Tweet Chat shows thought leadership in your industry, can drive traffic to your website, promote your overall marketing message, and help you engage directly with your customer base. Follow the following checklist by The Whole Brain Group to create one for your business!
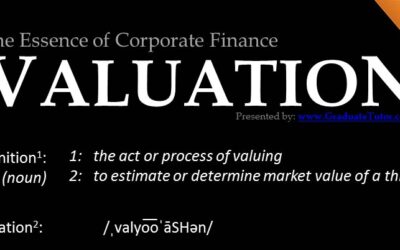
Valuation: The Essence of Corporate Finance
Valuation is the essence of Corporate Finance. As managers a key objective should be to maximize shareholder value. Without a good way to measure value, decision making is not objective! Valuation is what can guide management to be objective in decision making. This infographic is the first of an info-graphic series on corporate finance.

How Small Businesses Are Spending Their Money
See how your small business expenses compare to the national average. In the infographic by Shoeboxed, see data from 12,000+ small businesses showing small business insurance costs are up 25% in 2012 and utilities have doubled.

SlideShare for B2B Marketing
Does your business need to be on SlideShare? This infographic provides reasons why SlideShare is the best channel to promote your visual content. Re-purpose your blogs, eBooks, videos and white papers as presentations to reach a large B2B community.
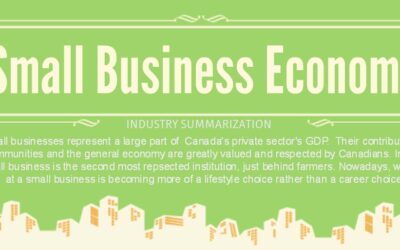
Small Business Economy in Canada
What do you know about small businesses in Canada? This handy infographic from Wagepoint breaks down the Canadian small business economy by business type, industry, GDP contributions, gender, and income . It also illustrates the success and failure rate of a business with fewer than 250 employees.
Graphic Design is Good for Business
Graphic design is everywhere and is a huge part of many businesses. One of the biggest parts of a business is their online website. Almost everyone uses the internet to find what they are looking for, and if your website isn’t eye catching and user friendly, then you have problems.
The Case for Single Line Queuing
This infographic from Lavi Industries addresses common concerns over the choice of single line or multiple waiting line configurations. The graphic presents key challenges and the business case for single line queuing.
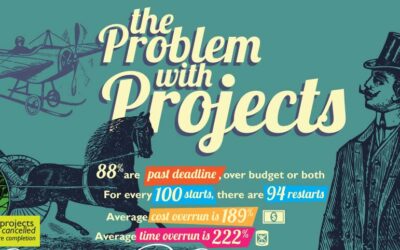
The Problem With Projects
If projects give you the willies, you’re not alone. More often than not, the project train ends up on the figurative snowbank beside the tracks. In fact, projects get derailed (pun definitely intended) mostly because of a lack of direction, resources, communication, and information.
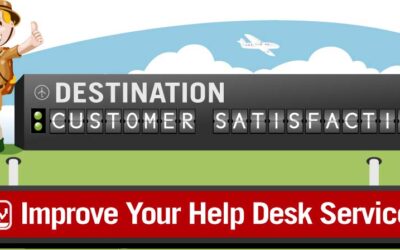
Improve Your Customer Service
The level of customer service you provide dictates the amount of return customers you get and improves the success of your business. Regardless of the type of business you operate, you rely on your customer service team to provide exceptional service and assistance. In the infographic below, learn what to avoid when communicating with customers, and ways to improve your customer service and help desk.
The Small Business Landscape
Small businesses make up 80% of the total number of businesses in the U.S. today. And for their owners, today’s economic environment presents a unique set of challenges and opportunities to build their business. Signs.com explores some of the pitfalls, plans and perspectives of current business owners to get an idea of how they succeed.
Sensible Tweet Chat Checklist for Businesses
Hosting a Tweet Chat shows thought leadership in your industry, can drive traffic to your website, promote your overall marketing message, and help you engage directly with your customer base. Follow the following checklist by The Whole Brain Group to create one for your business!
Valuation: The Essence of Corporate Finance
Valuation is the essence of Corporate Finance. As managers a key objective should be to maximize shareholder value. Without a good way to measure value, decision making is not objective! Valuation is what can guide management to be objective in decision making. This infographic is the first of an info-graphic series on corporate finance.
How Small Businesses Are Spending Their Money
See how your small business expenses compare to the national average. In the infographic by Shoeboxed, see data from 12,000+ small businesses showing small business insurance costs are up 25% in 2012 and utilities have doubled.
SlideShare for B2B Marketing
Does your business need to be on SlideShare? This infographic provides reasons why SlideShare is the best channel to promote your visual content. Re-purpose your blogs, eBooks, videos and white papers as presentations to reach a large B2B community.
Small Business Economy in Canada
What do you know about small businesses in Canada? This handy infographic from Wagepoint breaks down the Canadian small business economy by business type, industry, GDP contributions, gender, and income . It also illustrates the success and failure rate of a business with fewer than 250 employees.
Graphic Design is Good for Business
Graphic design is everywhere and is a huge part of many businesses. One of the biggest parts of a business is their online website. Almost everyone uses the internet to find what they are looking for, and if your website isn’t eye catching and user friendly, then you have problems.
The Case for Single Line Queuing
This infographic from Lavi Industries addresses common concerns over the choice of single line or multiple waiting line configurations. The graphic presents key challenges and the business case for single line queuing.
The Problem With Projects
If projects give you the willies, you’re not alone. More often than not, the project train ends up on the figurative snowbank beside the tracks. In fact, projects get derailed (pun definitely intended) mostly because of a lack of direction, resources, communication, and information.
Improve Your Customer Service
The level of customer service you provide dictates the amount of return customers you get and improves the success of your business. Regardless of the type of business you operate, you rely on your customer service team to provide exceptional service and assistance. In the infographic below, learn what to avoid when communicating with customers, and ways to improve your customer service and help desk.
Search 12,100+ Infographics!
Partners


Browse Archives By Category
Animated Infographics
Business Infographics
Career & Jobs Infographics
Education Infographics
Entertainment Industry Infographics
Environmental Infographics
Finance & Money Infographics
Food & Drink Infographics
Health Infographics
Historical Infographics
Home & Garden Infographics
Internet Infographics
Law and Legal Infographics
Lifestyle Infographics
Marketing Infographics
Offbeat Infographics
Parenting Infographics
Pets & Animals Infographics
Political Infographics
Shopping Infographics
Sports and Athletic Infographics
Technology Infographics
Transportation Infographics
Travel Infographics
Video Infographics