Business Infographics

Understanding Generational and Holiday Shopping Trends
This 2025 Equifax Holiday Spend Trends infographic offers a comprehensive look at the current state of US consumer finances and what retailers and lenders can anticipate in the coming months. Learn more about how to property understand and interpret generational and holiday shopping trends and market research report, courtesy of Equifax.
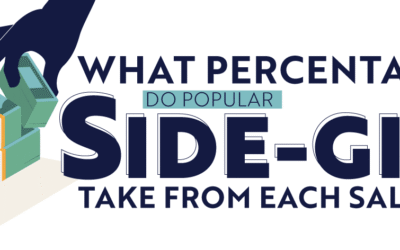
What Percentage Do Popular Side-Gig Apps Take From Each Sale in the U.S.?
A new article from LLC Attorney.com compiles data on fees collected by some of the most widely used freelance and side gig platforms. It shows how much of each transaction is retained by the app rather than the side-gig worker.

The Future of AI and Recruitment Software
Check out the follow infographic all about the ins and outs of recruitment software in the following visual deep dive, courtesy of graylink.
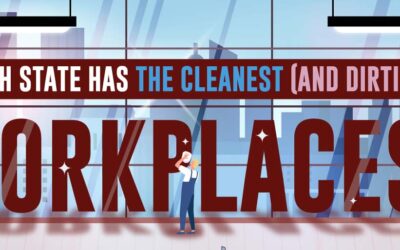
Which State Has The Cleanest (And Dirtiest) Workplaces?
The team at Stratus Building Solutions brings us a study analyzing the cleanest and dirtiest workplaces by state. They developed their own methodology to rank workplaces in each state by their cleanliness. Their methods considered OSHA sanitation, air pollution, population density, state-mandated sick leave laws, and the rate of janitors per capita.
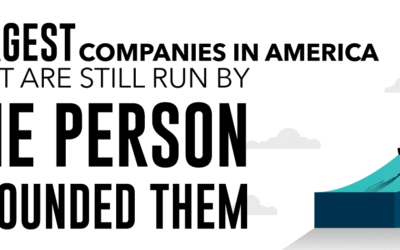
Largest Companies in America Still Run by the Person Who Founded Them
While shake-ups are common in the corporate world, with new CEOs being the norm, not the exception, some founders stand out from the crowd with a long history leading the company. The Chartistry team brings us a new graphic showing us which founders still have control over their companies, weathering ups and downs to remain on top.

5 Mind-Blowing Multi-Million Dollar Startup Business Ideas
This infographic highlights five quirky startup ideas that transformed into multimillion-dollar ventures. From the simple smiley face design and the fad of pet rocks, to novelty truck accessories, the infamous Snuggie, and even a website selling pixels, the graphic shows how unusual concepts captured mass attention.
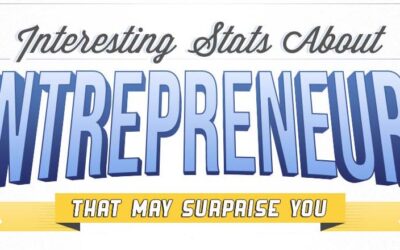
9 Surprising Stats About Entrepreneurs That Will Inspire You
Here is an infographic from the marketing team at Unitel Voice which reveals nine surprising facts about entrepreneurs that challenge stereotypes. The graphic encourages aspiring founders by illustrating that entrepreneurship is within reach — regardless of age, education, or background.
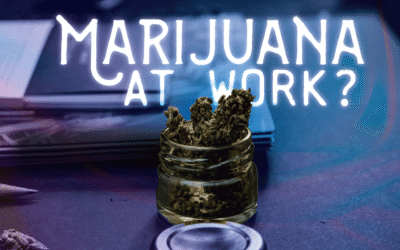
A Guide to State Marijuana Laws
When it comes to state marijuana laws in the United States, you need to keep up with the latest and greatest information. Check out the following infographic from US Drug Test Centers which serves as a guide to state marijuana laws.
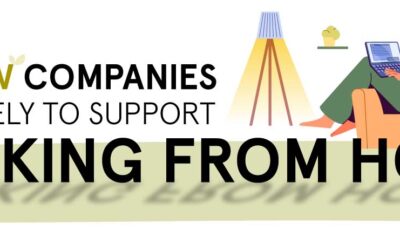
Are New Companies More Likely to Support Working From Home?
Many employees would strongly prefer work-from-home options, but some companies hesitate to offer those options. The team at Ooma examined what patterns might emerge in work-from-home attitudes and what obstacles stand in the way of remote work options.
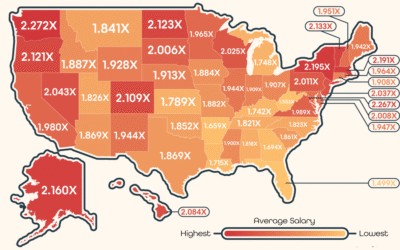
Small Business Owner Salaries By State Compared to the U.S. Average
Any aspiring entrepreneurs out there should examine Ooma’s new infographic showing average salaries by state. This graphic reveals that small business owners earn more than the national wage average. We can see from the map, though, that geography does impact potential earnings.
Understanding Generational and Holiday Shopping Trends
This 2025 Equifax Holiday Spend Trends infographic offers a comprehensive look at the current state of US consumer finances and what retailers and lenders can anticipate in the coming months. Learn more about how to property understand and interpret generational and holiday shopping trends and market research report, courtesy of Equifax.
What Percentage Do Popular Side-Gig Apps Take From Each Sale in the U.S.?
A new article from LLC Attorney.com compiles data on fees collected by some of the most widely used freelance and side gig platforms. It shows how much of each transaction is retained by the app rather than the side-gig worker.
The Future of AI and Recruitment Software
Check out the follow infographic all about the ins and outs of recruitment software in the following visual deep dive, courtesy of graylink.
Which State Has The Cleanest (And Dirtiest) Workplaces?
The team at Stratus Building Solutions brings us a study analyzing the cleanest and dirtiest workplaces by state. They developed their own methodology to rank workplaces in each state by their cleanliness. Their methods considered OSHA sanitation, air pollution, population density, state-mandated sick leave laws, and the rate of janitors per capita.
Largest Companies in America Still Run by the Person Who Founded Them
While shake-ups are common in the corporate world, with new CEOs being the norm, not the exception, some founders stand out from the crowd with a long history leading the company. The Chartistry team brings us a new graphic showing us which founders still have control over their companies, weathering ups and downs to remain on top.
5 Mind-Blowing Multi-Million Dollar Startup Business Ideas
This infographic highlights five quirky startup ideas that transformed into multimillion-dollar ventures. From the simple smiley face design and the fad of pet rocks, to novelty truck accessories, the infamous Snuggie, and even a website selling pixels, the graphic shows how unusual concepts captured mass attention.
9 Surprising Stats About Entrepreneurs That Will Inspire You
Here is an infographic from the marketing team at Unitel Voice which reveals nine surprising facts about entrepreneurs that challenge stereotypes. The graphic encourages aspiring founders by illustrating that entrepreneurship is within reach — regardless of age, education, or background.
A Guide to State Marijuana Laws
When it comes to state marijuana laws in the United States, you need to keep up with the latest and greatest information. Check out the following infographic from US Drug Test Centers which serves as a guide to state marijuana laws.
Are New Companies More Likely to Support Working From Home?
Many employees would strongly prefer work-from-home options, but some companies hesitate to offer those options. The team at Ooma examined what patterns might emerge in work-from-home attitudes and what obstacles stand in the way of remote work options.
Small Business Owner Salaries By State Compared to the U.S. Average
Any aspiring entrepreneurs out there should examine Ooma’s new infographic showing average salaries by state. This graphic reveals that small business owners earn more than the national wage average. We can see from the map, though, that geography does impact potential earnings.
Search 12,100+ Infographics!
Partners


Browse Archives By Category
Animated Infographics
Business Infographics
Career & Jobs Infographics
Education Infographics
Entertainment Industry Infographics
Environmental Infographics
Finance & Money Infographics
Food & Drink Infographics
Health Infographics
Historical Infographics
Home & Garden Infographics
Internet Infographics
Law and Legal Infographics
Lifestyle Infographics
Marketing Infographics
Offbeat Infographics
Parenting Infographics
Pets & Animals Infographics
Political Infographics
Shopping Infographics
Sports and Athletic Infographics
Technology Infographics
Transportation Infographics
Travel Infographics
Video Infographics