Business Infographics

Can Your Office Be Good for Your Health?
The perfect office environment will mean different things to different people. For some it is about the equipment used, where as others may place more emphasis on the area they work in. This infographic by CIPHR will hopefully have some suggestions everyone will be able to use to make their office a healthier place to work.
The Current State of Online Business
The Internet is a very important and powerful source of revenue growth that some small business owners ares still wary of how to embrace it. Below is an infographic from homestead that shows us how important the internet is to small businesses and how you can stay competitive, acquire customers and make more sales. So let’s take a look at the “Current Status of Online Business” and see why having an online presence is vital to your business.
Is Your Industry Growing or Dying?
Construction and healthcare-related fields are expected to see exponential growth in the next decade, while jobs at the Post Office and newspapers, well, may go the way of the dodo. Masters In Human Resources Degree Guide takes a look at industries that are growing as well as those that may be dying.

Canadian Women Entrepreneurs
‘Canadian Women In Entrepreneurs’ highlights Canadian women entrepreneurs, women owned businesses and the demanding work week of these hard working business women. Did you know 1 out of 3 Canadian entrepreneurs is a women? Learn more in the infographic below.
10 Movers & Shakers of Silicon Valley
In this infographic, discover 10 entrepreneurs that went big and call nothing but the Valley home. Veterans and newbies alike rock the worlds of tech, social media, and business.
It’s a SaaS World
Software as a Service is growing rapidly. Check out the infographic below presented by ProfitBricks to to learn how SaaS differs from other software delivery models, the history of SaaS, SaaS growth drivers, and the future of cloud computing.

Celebrating Women in Manufacturing
This May 29th will mark the 70th anniversary of the publishing of Norman Rockwell’s iconic “Rosie the Riveter” painting on the cover of the Saturday Evening Post (published May 29th, 1943). “Rosie the Riveter” inspired a social movement that increased the number of working American women. From 1940 – 1944 the number of women in America rose from 12 million to 20 million.
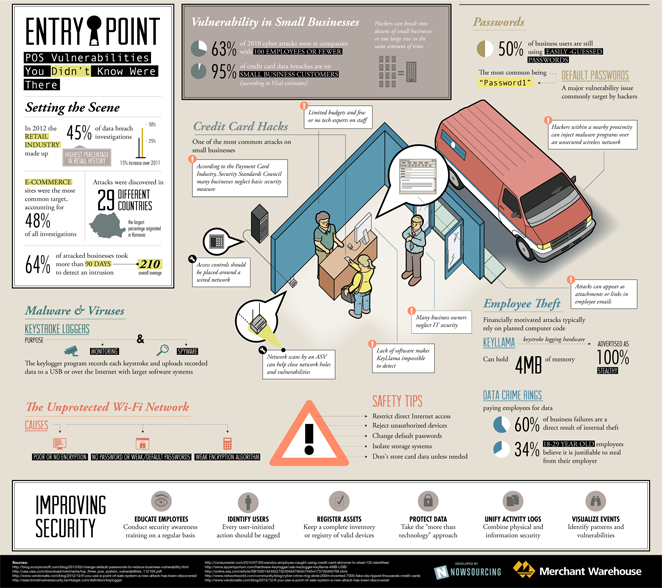
Entry Point: POS Vulnerabilities You Didn’t Know Where There
Many small business owners think they are safe from data breaches because hackers are going for bigger businesses. However, this is not the case. According to Visa’s estimates 95% of credit card data breaches are on small business customers. Check out the infographic below to learn about POS vulnerabilities for small businesses.
Executive Twits: Inside The Mind of a CE(psych)O
It takes a different sort of mind to run a major company successfully. Sometimes it’s genius that sets apart the business elite-but sometimes it just may be madness. www.psychdegrees.org takes a look at the studies and profiles that show what make these leaders tick-and why that ticking sound may just be a psychopathic time bomb.

How to Get Higher Sales for Your Ecommerce Platform?
The objective of any business, be it brick-mortar or web based, is to maximize sales for greater profits. Like real world, it is achieved in the web realm by focusing on marketing and advertising. While efforts in mentioned fields bring fresh traffic, changing those potential visitors into buyers depends entirely on conversion funnel and related elements. Higher sales can be achieved by keeping buyer psychology in mind.
Can Your Office Be Good for Your Health?
The perfect office environment will mean different things to different people. For some it is about the equipment used, where as others may place more emphasis on the area they work in. This infographic by CIPHR will hopefully have some suggestions everyone will be able to use to make their office a healthier place to work.
The Current State of Online Business
The Internet is a very important and powerful source of revenue growth that some small business owners ares still wary of how to embrace it. Below is an infographic from homestead that shows us how important the internet is to small businesses and how you can stay competitive, acquire customers and make more sales. So let’s take a look at the “Current Status of Online Business” and see why having an online presence is vital to your business.
Is Your Industry Growing or Dying?
Construction and healthcare-related fields are expected to see exponential growth in the next decade, while jobs at the Post Office and newspapers, well, may go the way of the dodo. Masters In Human Resources Degree Guide takes a look at industries that are growing as well as those that may be dying.
Canadian Women Entrepreneurs
‘Canadian Women In Entrepreneurs’ highlights Canadian women entrepreneurs, women owned businesses and the demanding work week of these hard working business women. Did you know 1 out of 3 Canadian entrepreneurs is a women? Learn more in the infographic below.
10 Movers & Shakers of Silicon Valley
In this infographic, discover 10 entrepreneurs that went big and call nothing but the Valley home. Veterans and newbies alike rock the worlds of tech, social media, and business.
It’s a SaaS World
Software as a Service is growing rapidly. Check out the infographic below presented by ProfitBricks to to learn how SaaS differs from other software delivery models, the history of SaaS, SaaS growth drivers, and the future of cloud computing.
Celebrating Women in Manufacturing
This May 29th will mark the 70th anniversary of the publishing of Norman Rockwell’s iconic “Rosie the Riveter” painting on the cover of the Saturday Evening Post (published May 29th, 1943). “Rosie the Riveter” inspired a social movement that increased the number of working American women. From 1940 – 1944 the number of women in America rose from 12 million to 20 million.
Entry Point: POS Vulnerabilities You Didn’t Know Where There
Many small business owners think they are safe from data breaches because hackers are going for bigger businesses. However, this is not the case. According to Visa’s estimates 95% of credit card data breaches are on small business customers. Check out the infographic below to learn about POS vulnerabilities for small businesses.
Executive Twits: Inside The Mind of a CE(psych)O
It takes a different sort of mind to run a major company successfully. Sometimes it’s genius that sets apart the business elite-but sometimes it just may be madness. www.psychdegrees.org takes a look at the studies and profiles that show what make these leaders tick-and why that ticking sound may just be a psychopathic time bomb.
How to Get Higher Sales for Your Ecommerce Platform?
The objective of any business, be it brick-mortar or web based, is to maximize sales for greater profits. Like real world, it is achieved in the web realm by focusing on marketing and advertising. While efforts in mentioned fields bring fresh traffic, changing those potential visitors into buyers depends entirely on conversion funnel and related elements. Higher sales can be achieved by keeping buyer psychology in mind.
Search 12,100+ Infographics!
Partners


Browse Archives By Category
Animated Infographics
Business Infographics
Career & Jobs Infographics
Education Infographics
Entertainment Industry Infographics
Environmental Infographics
Finance & Money Infographics
Food & Drink Infographics
Health Infographics
Historical Infographics
Home & Garden Infographics
Internet Infographics
Law and Legal Infographics
Lifestyle Infographics
Marketing Infographics
Offbeat Infographics
Parenting Infographics
Pets & Animals Infographics
Political Infographics
Shopping Infographics
Sports and Athletic Infographics
Technology Infographics
Transportation Infographics
Travel Infographics
Video Infographics