Education Infographics
Budget Cut Blues: Special Education
There is no one resource more important than our children. Special Education Degree has created an infographic entitled “Budget Cut Blues: How Special Education Students Are Among the Biggest Victims of Federal Spending Drops” detailing how we are leaving our children with special needs behind due to the latest round of budget cuts.
A College Student’s Guide To Finding Mentors
Do you have goals that you want to accomplish? Maybe get an internship this summer? Or complete a semester project before the last day? Or hit the gym a ton and get fit? This infographic shows you how you can accomplish your goals faster and easier by planning better through the help of a mentor.
President Vs. Student: Exploring University President Salaries
You hear stories about business CEOs and their inflated salaries, but Nonprofit Colleges Online has created an infographic entitled “President vs. Student: Exploring University President Salaries”, detailing what these education moguls rake in every year.
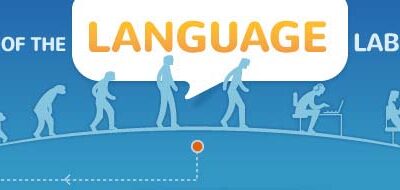
The Evolution of the Language Lab
This infographic presents the origins, golden age and future of the language laboratory. The Schoolshape language lab is a cloud-based language lab that is constantly improved with suggestions from its users. It is especially effective in supporting mobile assisted language learning and teaching with the communicative method.
Convenience Playing A Role In The Surge Of MBA Enrollments
Whether pursued for a salary increase, a promotion, or change in careers, an MBA empowers professionals to pursue the next stage in their careers. This piece highlights the benefits of an online MBA program and why more and more business professionals are turning to the web for education.
Top Social Universities in Canada
Universities compete fiercely with one another for funding, rankings, and for prospective students. But how about social influence? MediaMiser tracked Canada’s universities on Twitter and Facebook this winter to see which schools should be on the Dean’s social media list.
Hacking Your Way Through College
College doesn’t seem as overwhelming if you know how to hack your way through it. Check out the following infographic presented by BestCollegeReviews.org to learn how to survive college.
The Developmental Stages of a Preschooler
In this infographic, discover some statistics on American preschools including showing just how important preschool is for a developing child.
How Google is Changing Education
Google’s Education initiatives have made strides in improving education for students across the globe. In this infographic, learn about Google programs that can benefit you.
Are Public Schools Closing the Curtains on Creativity?
By now we’ve all heard that Uncle Sam’s current, economic status has led to nationwide budget cuts. While all departments are heaving under the weight of burdening finances, both budget cuts and reduction of available arts and humanities courses particularly plague the U.S. ‘creative industry’ sector.
Search 12,000+ Infographics!
Partners
Browse Archives By Category
Animated Infographics
Business Infographics
Career & Jobs Infographics
Education Infographics
Entertainment Industry Infographics
Environmental Infographics
Finance & Money Infographics
Food & Drink Infographics
Health Infographics
Historical Infographics
Home & Garden Infographics
Internet Infographics
Law and Legal Infographics
Lifestyle Infographics
Marketing Infographics
Offbeat Infographics
Parenting Infographics
Pets & Animals Infographics
Political Infographics
Shopping Infographics
Sports and Athletic Infographics
Technology Infographics
Transportation Infographics
Travel Infographics
Video Infographics


