Entertainment Industry Infographics
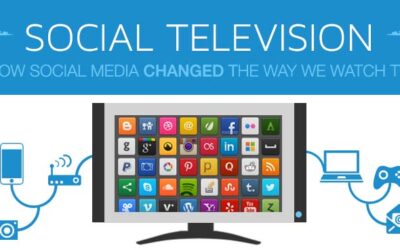
How Social Media Changed The Way We Watch TV
In the following infographic, BlueHost outlines a few recent examples that illustrate how social media has changed the way television is made and watched, how social media is playing a role in televised political elections, how it is being used as a way to boost audience participation in popular voting shows like The Voice, and what’s in store for the future.

Star Trek Episodes Timeline For TV Shows & Movies
“Star Trek” only stayed on 3 seasons, but it had an unmatched effect on millions around the globe. The first series starred William Shatner and Leonard Nimoy as Captain James T. Kirk and Mister Spock, the very first officer aboard the Enterprise. Jointly, Shatner and Nimoy portrayed Kirk and Spock through 3 seasons on the show and 6 movies.

The Formula for a Fall Movie Blockbuster
Are you excited about all the amazing movies coming out this Fall? The folks at Animation Mentor are too! In fact, they’re so excited that they combed the internet to discover a ton of great facts about what it takes to make a Fall blockbuster successful – from an analysis of the most popular color for movie posters to how many Twitter followers a typical VFX Supervisor has.

Pawn Stars vs. Antiques Roadshow
Whether you’re a fan of History Channel’s “Pawn Stars” or PBS’s “Antiques Roadshow”, this infographic is for you! It compares the number of episodes, seasons, viewers, most expensive appraisals, and more. You can also find a series of interesting facts about both shows that many fans don’t know about.

Double (and Triple) Screening
The folks at GAME have revealed that their love of interacting and sharing with others during TV shows mean eight in ten Brits now use a phone, tablet or laptop to share their opinions online about the program they are viewing. Half will even combine all three – watching TV, browsing on a laptop or PC whilst using their smartphone.
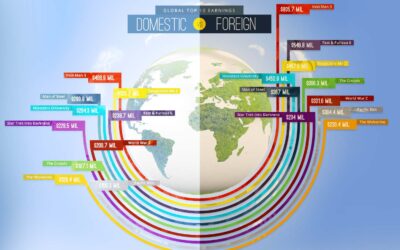
2013 Top Summer Movies
Dish Systems has put together the following infographic that includes some pretty interesting stats in this on top grossing summer movies. For example, the opening weekend of Iron Man 3 generated $174.2, while The Great Gatsby generated $50.1. Disney’s Lone Ranger also fell $126.6 under budget.

Apps vs. Cable: Is Traditional Cable Still Worth It?
With the average price of cable television hitting an average of $86 a month and climbing at 6% per year to an anticipated $200 per month by 2020, is the cost of traditional cable still worth it? Add to this argument that there are an abundant supply of “cable alternatives” and one has to wonder just how long cable providers can continue to survive.

The Anatomy of a Scary Movie
Horror movies are a science, just the right mix of thrills and chills to get our blood pumping. This infographic reveals how some of the masters of horror have created some of the most beloved horror films of all time.
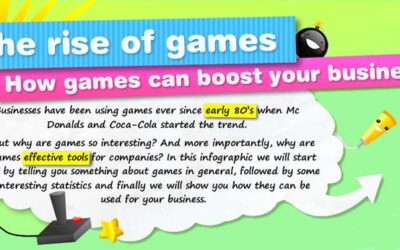
The Rise of Games
Businesses have been using games ever since early 80’s when McDonalds and Coca-Cola started the trend. But why are games so interesting? And more importantly, why are games effective tools for companies?

Do You Even Lift, Bro?
Ever wonder what it would actually take for a tornado to be able to pick up a shark? Well, wonder no more. Check out the infographic below presented by National Pallets to learn some cool facts about lifting. [Click image for full size version]
How Social Media Changed The Way We Watch TV
In the following infographic, BlueHost outlines a few recent examples that illustrate how social media has changed the way television is made and watched, how social media is playing a role in televised political elections, how it is being used as a way to boost audience participation in popular voting shows like The Voice, and what’s in store for the future.
Star Trek Episodes Timeline For TV Shows & Movies
“Star Trek” only stayed on 3 seasons, but it had an unmatched effect on millions around the globe. The first series starred William Shatner and Leonard Nimoy as Captain James T. Kirk and Mister Spock, the very first officer aboard the Enterprise. Jointly, Shatner and Nimoy portrayed Kirk and Spock through 3 seasons on the show and 6 movies.
The Formula for a Fall Movie Blockbuster
Are you excited about all the amazing movies coming out this Fall? The folks at Animation Mentor are too! In fact, they’re so excited that they combed the internet to discover a ton of great facts about what it takes to make a Fall blockbuster successful – from an analysis of the most popular color for movie posters to how many Twitter followers a typical VFX Supervisor has.
Pawn Stars vs. Antiques Roadshow
Whether you’re a fan of History Channel’s “Pawn Stars” or PBS’s “Antiques Roadshow”, this infographic is for you! It compares the number of episodes, seasons, viewers, most expensive appraisals, and more. You can also find a series of interesting facts about both shows that many fans don’t know about.
Double (and Triple) Screening
The folks at GAME have revealed that their love of interacting and sharing with others during TV shows mean eight in ten Brits now use a phone, tablet or laptop to share their opinions online about the program they are viewing. Half will even combine all three – watching TV, browsing on a laptop or PC whilst using their smartphone.
2013 Top Summer Movies
Dish Systems has put together the following infographic that includes some pretty interesting stats in this on top grossing summer movies. For example, the opening weekend of Iron Man 3 generated $174.2, while The Great Gatsby generated $50.1. Disney’s Lone Ranger also fell $126.6 under budget.
Apps vs. Cable: Is Traditional Cable Still Worth It?
With the average price of cable television hitting an average of $86 a month and climbing at 6% per year to an anticipated $200 per month by 2020, is the cost of traditional cable still worth it? Add to this argument that there are an abundant supply of “cable alternatives” and one has to wonder just how long cable providers can continue to survive.
The Anatomy of a Scary Movie
Horror movies are a science, just the right mix of thrills and chills to get our blood pumping. This infographic reveals how some of the masters of horror have created some of the most beloved horror films of all time.
The Rise of Games
Businesses have been using games ever since early 80’s when McDonalds and Coca-Cola started the trend. But why are games so interesting? And more importantly, why are games effective tools for companies?
Do You Even Lift, Bro?
Ever wonder what it would actually take for a tornado to be able to pick up a shark? Well, wonder no more. Check out the infographic below presented by National Pallets to learn some cool facts about lifting. [Click image for full size version]
Search 12,100+ Infographics!
Partners


Browse Archives By Category
Animated Infographics
Business Infographics
Career & Jobs Infographics
Education Infographics
Entertainment Industry Infographics
Environmental Infographics
Finance & Money Infographics
Food & Drink Infographics
Health Infographics
Historical Infographics
Home & Garden Infographics
Internet Infographics
Law and Legal Infographics
Lifestyle Infographics
Marketing Infographics
Offbeat Infographics
Parenting Infographics
Pets & Animals Infographics
Political Infographics
Shopping Infographics
Sports and Athletic Infographics
Technology Infographics
Transportation Infographics
Travel Infographics
Video Infographics