Environmental Infographics
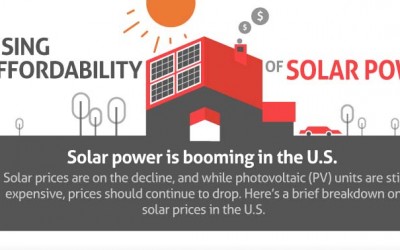
The Rising Affordability of Solar Power
Prices are continuing to drop for solar power. This infographic by SolarTech illustrates the prices in the U.S. and why solar power is becoming more affordable.
The Survivalist Guide: Prepping for Natural Disasters & Other Emergencies
Natural disasters happen. Find out what you should do when disaster strikes and what tools you will need to respond to impending dangers in this infographic from Wise Company.
Winter Survival Hacks
Winter is well and truly underway, and until now the weather has been tolerable. But it might be an idea to prepare to outsmart Jack Frost so you can go about your business when the weather turns arctic. The folks at Jones Oil have put together their top winter survival hacks for your home, car and even your health.
A Survivalist’s Guide to Eating in the Wilderness
This infographic is a handy guide for those who love to explore the wilderness and spend a lot of time living off what nature has to offer. Several plants and flowers are broken down into what is edible and what is not. There are also handy tips on other uses for some of these plants and flowers.
How to React to Extreme Weather When Driving
While you may think that driving in adverse weather is no big deal, the fact is that 22% of all car accidents are weather-related. So, how can you keep your family and friends safe when driving? In this infographic by CJ Pony Parts, learn how to properly react to conditions such as snow, ice, rain, tornadoes, and high heat.
Go Grey: Properly Dispose of Outdated Phone Books
The Berry Company/Hawaiian Telcom Yellow Pages worked in collaboration with the City of Honolulu to create an infographic to raise awareness about proper outdated phone book disposal in Oahu. The infographic shares important facts for the community.
The World’s Smartest Cities
This infographic takes a look at “smart cities” designed using technologies and innovations that deal with proper waste disposal, use of renewable energy sources, an effective keeping of peace and security and, water conservation.
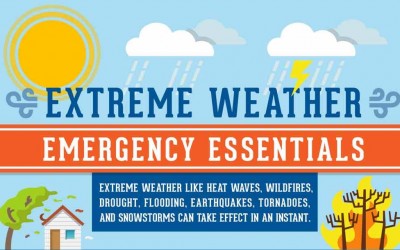
Extreme Weather Guideline
Extreme weather can find us. In each of these situations, it’s important to be prepared for anything. By planning ahead, you can ensure the safety of you, your family, and friends. With this infographic from JKMechanical.com, you can prepare for any situation in any kind of weather.
Polar Vortex 2.0
A few winters ago marked one of the coldest winters on record thanks to the Polar Vortex that enveloped most of America. How is a Polar Vortex formed and what can you expect this winter season? EquipSupply has compiled some facts and figures about the upcoming Polar Vortex 2.0 to get you prepared for the long cold months ahead.
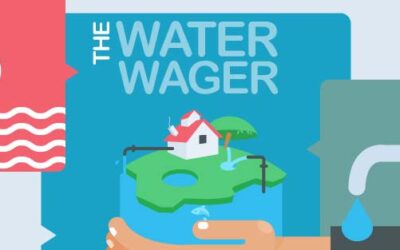
The Water Wager
Ever wonder the true cost of neglecting water conservation? The average American family uses hundreds of gallons of water each day. How much are you willing to give up by betting with water? This infographic takes a look at the true cost of neglecting water conservation.
Search 12,000+ Infographics!
Partners
Browse Archives By Category
Animated Infographics
Business Infographics
Career & Jobs Infographics
Education Infographics
Entertainment Industry Infographics
Environmental Infographics
Finance & Money Infographics
Food & Drink Infographics
Health Infographics
Historical Infographics
Home & Garden Infographics
Internet Infographics
Law and Legal Infographics
Lifestyle Infographics
Marketing Infographics
Offbeat Infographics
Parenting Infographics
Pets & Animals Infographics
Political Infographics
Shopping Infographics
Sports and Athletic Infographics
Technology Infographics
Transportation Infographics
Travel Infographics
Video Infographics


