Environmental Infographics
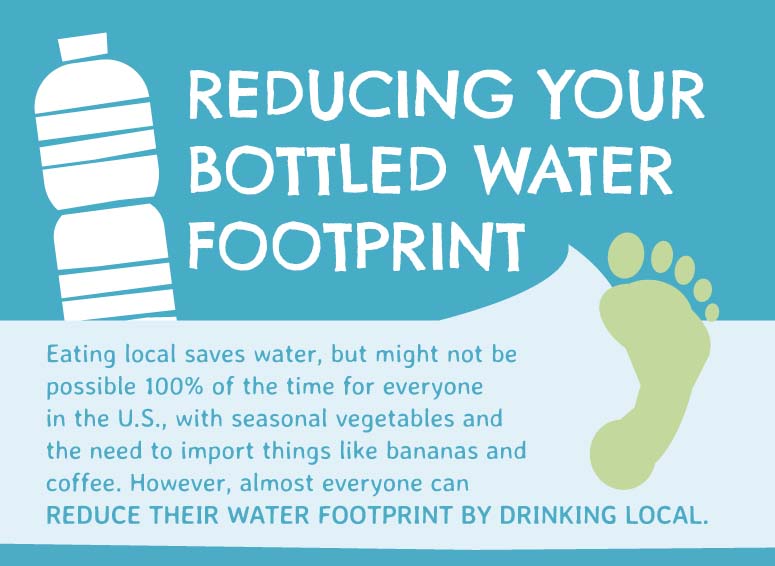
Reducing Your Bottled Water Footprint
An estimated 50 to 80 percent of all life on earth is found under the ocean’s surface. For this reason, it’s up to humans to keep our oceans clean and free of contaminants. Unfortunately, things like air pollution, refined oil, rubbish, and human pollution are all responsible for polluting our oceans.
The Rise of Eco-Friendly Golf Courses
Very few non-motorised sports come under fire as regularly as golf for their environmental impact. What is sometimes overlooked is the amount of work golf is doing to ameliorate the effect it has on the environment, and in some cases even endeavoring to be a positive force in landscape management.
How Hurricanes Impact You
This infographic from Direct Energy looks at hurricanes and provides the information and tips you need on what to expect, how to prepare, and what to watch for during hurricane seasons.
How Reusable Bags Can Save the World and Your Brand
Society today has a responsibility to accept the damage that has been done to our planet in order to move forward and take action to achieve positive change. We have already taken some important steps with the recent announcement of the Clean Power Plan, which establishes the first-ever national standards to limit carbon pollution from power plants.
Energy Consumption In Homes Across Europe
We are all being asked to shrink our carbon footprint by reducing energy consumption, but have you ever wondered how energy efficient the UK is compared with other European neighbors? This infographic highlights the present and future targets for reducing energy consumption.
5 Big Brands Using Renewable Energy & What Small Businesses Can Learn
Some of the biggest companies in the world are starting to implement renewable energy. But you don’t have to own big company to follow their steps. Check out this interesting infographic to discover what can you learn from those big brands and implement that tips in your business.
Natural Disasters – Can We Help?
Natural hazards do not have to become natural disasters. The death tolls from these tragedies can be minimized with better planning and more efficient use of donations. This infographic looks at natural disasters and how we can help.
Non-Renewable Energy – How Short-Termism is Killing Our Planet
Fossil fuels currently drive around 90% of energy production levels. Latest figures suggest that our most plentiful resource, coal, has a maximum lifespan of 250 years, with oil and natural gas falling much shorter. This infographic outlines how a dependence on fossil fuels is putting the long term future of our planet in jeopardy.
Why Solar? Why Does It Matter? Why Now?
Energy costs continue to rise and the sun continues to shine. Why aren’t we taking advantage of the suns generous rays? Especially since, solar panels have dropped in price so dramatically over the last few years and have become far more efficient. Most people see a 250% return on their investment.
Severe Flooding in the UK
This infographic details the severe flooding that has occurred in the United Kingdom and the subsequent consequences to everything that gets in its way.
Search 12,000+ Infographics!
Partners
Browse Archives By Category
Animated Infographics
Business Infographics
Career & Jobs Infographics
Education Infographics
Entertainment Industry Infographics
Environmental Infographics
Finance & Money Infographics
Food & Drink Infographics
Health Infographics
Historical Infographics
Home & Garden Infographics
Internet Infographics
Law and Legal Infographics
Lifestyle Infographics
Marketing Infographics
Offbeat Infographics
Parenting Infographics
Pets & Animals Infographics
Political Infographics
Shopping Infographics
Sports and Athletic Infographics
Technology Infographics
Transportation Infographics
Travel Infographics
Video Infographics
