Environmental Infographics
50 Incredible Facts About Water
The following infographic communicates Aquatec’s passion for pure water and our amazing planet. It showcases 50 incredible facts about water and takes you on a journey from outer space into an average UK home. It features everything from Scottish rainfall to Martian Dirt, from a pair of jeans to the International Space Station.
The Burgeoning Bakken
North Dakota may be known as the Peace Garden state, however, it’s quickly becoming known as the Oil state – all because of the Bakken. UG Center has created an infographic entitled “The Burgeoning Bakken”, guiding you though one of the largest oil deposits in our nation, and its effects on the land and people around it.
Safe Marijuana Cultivation
Now that marijuana is legal in Washington, the cannabis industry is booming in the Seattle area. This infographic by WasteXpress shows the long road to legalization in Washington and some of the different types of waste that can be by-products of marijuana production.
Green Zone
From recycling paper to offices using wind power, our workplaces are adopting more green technologies every day. Here is an infographic entitled “Green Zone”, detailing how companies around the nation are starting to put green technology into place in the workplace, and just what a booming industry it is.

Our Weird Planet According to Google
When Google Earth first came onto the scene, users had mixed feelings regarding its detailed nature. Once Googlers got used to the software, they started exploring, and came across an amazing array of incredible sights. Here’s an infographic highlighting some of the most incredible sights Google Earth users have found.

Upcycling With Glass
Within the past few years “up cycling” has become a very popular and also a great way of promoting recycling. So if you’re wanting to try something new and are ready to turn your hand to try up cycling yourself but aren’t quite sure where to start, here is the perfect infographic for you.
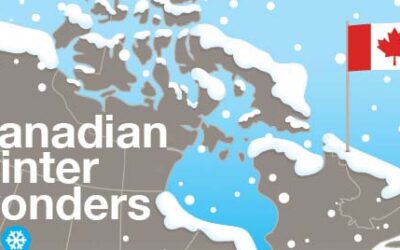
Canadian Winter Wonders
In the true north, winters have become part of the Canadian identity and culture. How does the average Canadian celebrate and endure the winter months? They bundle up, invent new delicacies and play a lot of winter sports. In fact, Canadians have even been known to go to some bizarre extremes when the weather turns polar.
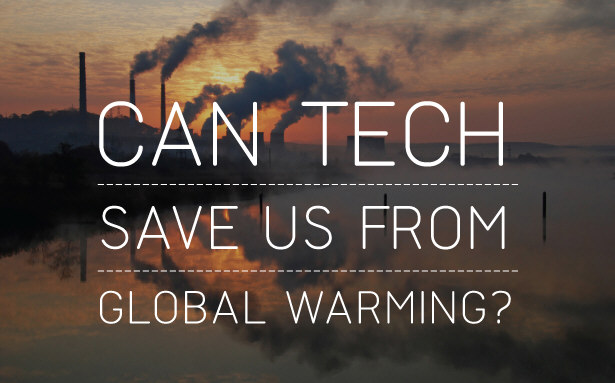
Can Tech Save Us From Global Warming?
Can technology save us from global warming? The following infographic seeks to educate one about global warming issues and proposed solutions by various scientists.
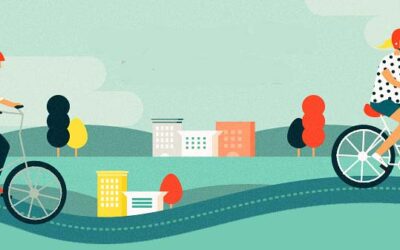
Footloose and Car Free
While many American adults enjoy the perk of owning a car, as they pull out of their garage, they overlook one mode of transportation that may very well serve as not only an alternative mode of transportation, but also a key to a healthy life.
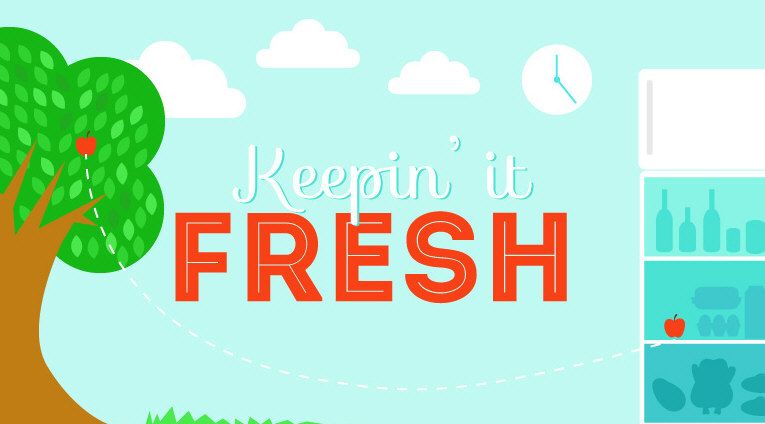
Keepin’ it Fresh: Refrigerator Revamp Guide
Americans waste a lot of food, and Part Select has created an infographic entitled “Keepin’ it Fresh”, detailing how food waste is impacting our environment, and how you can do your part to reduce the amount of food you throw out. For example, 40 percent of our food goes uneaten, costing $165 billion per year.
50 Incredible Facts About Water
The following infographic communicates Aquatec’s passion for pure water and our amazing planet. It showcases 50 incredible facts about water and takes you on a journey from outer space into an average UK home. It features everything from Scottish rainfall to Martian Dirt, from a pair of jeans to the International Space Station.
The Burgeoning Bakken
North Dakota may be known as the Peace Garden state, however, it’s quickly becoming known as the Oil state – all because of the Bakken. UG Center has created an infographic entitled “The Burgeoning Bakken”, guiding you though one of the largest oil deposits in our nation, and its effects on the land and people around it.
Safe Marijuana Cultivation
Now that marijuana is legal in Washington, the cannabis industry is booming in the Seattle area. This infographic by WasteXpress shows the long road to legalization in Washington and some of the different types of waste that can be by-products of marijuana production.
Green Zone
From recycling paper to offices using wind power, our workplaces are adopting more green technologies every day. Here is an infographic entitled “Green Zone”, detailing how companies around the nation are starting to put green technology into place in the workplace, and just what a booming industry it is.
Our Weird Planet According to Google
When Google Earth first came onto the scene, users had mixed feelings regarding its detailed nature. Once Googlers got used to the software, they started exploring, and came across an amazing array of incredible sights. Here’s an infographic highlighting some of the most incredible sights Google Earth users have found.
Upcycling With Glass
Within the past few years “up cycling” has become a very popular and also a great way of promoting recycling. So if you’re wanting to try something new and are ready to turn your hand to try up cycling yourself but aren’t quite sure where to start, here is the perfect infographic for you.
Canadian Winter Wonders
In the true north, winters have become part of the Canadian identity and culture. How does the average Canadian celebrate and endure the winter months? They bundle up, invent new delicacies and play a lot of winter sports. In fact, Canadians have even been known to go to some bizarre extremes when the weather turns polar.
Can Tech Save Us From Global Warming?
Can technology save us from global warming? The following infographic seeks to educate one about global warming issues and proposed solutions by various scientists.
Footloose and Car Free
While many American adults enjoy the perk of owning a car, as they pull out of their garage, they overlook one mode of transportation that may very well serve as not only an alternative mode of transportation, but also a key to a healthy life.
Keepin’ it Fresh: Refrigerator Revamp Guide
Americans waste a lot of food, and Part Select has created an infographic entitled “Keepin’ it Fresh”, detailing how food waste is impacting our environment, and how you can do your part to reduce the amount of food you throw out. For example, 40 percent of our food goes uneaten, costing $165 billion per year.
Search 12,000+ Infographics!
Partners


Browse Archives By Category
Animated Infographics
Business Infographics
Career & Jobs Infographics
Education Infographics
Entertainment Industry Infographics
Environmental Infographics
Finance & Money Infographics
Food & Drink Infographics
Health Infographics
Historical Infographics
Home & Garden Infographics
Internet Infographics
Law and Legal Infographics
Lifestyle Infographics
Marketing Infographics
Offbeat Infographics
Parenting Infographics
Pets & Animals Infographics
Political Infographics
Shopping Infographics
Sports and Athletic Infographics
Technology Infographics
Transportation Infographics
Travel Infographics
Video Infographics