Environmental Infographics
Go Green! The Bountiful Benefits of Responsible Recycling
The amount of lumber used to build homes in the U.S. each year could stretch around the circumference of the Earth 120 times. If construction companies start to recycle materials like lumber, we can drastically reduce our country’s waste production. This waste management and recycling infographic shows you more.
Hurricane Vs. House
Catastrophic weather is no joke. Some people lose everything, including loved ones, and have to rebuild their lives from scratch. Our friends at Bluhomes know how tough it can be and are offering a discount to those affected by the very recent Hurricane Sandy.
How To Be Green When Printing Plastic Cards
Recycling is an amazing thing, when it works. Unfortunately when it comes to plastic cards there’s a slight problem. Not all plastic gets recycled. Normally only bottles made from PET and HDPE are recycled. Most municipal facilities are simply not capable of recycling other types of plastic. So with plastic cards, the key is to get the printing right.
The Deadliest U.S. Hurricanes
Hurricanes kill an average of 17 people in the United States every year. But some storms claim much higher death tolls than others. What are the chances that you will sustain a personal injury or worse during a hurricane? Learn more with the following infographic by Total Injury.
Buzzing Off: How Dying Bees Affect You
Since the mid 2000s, honey bees have been mysteriously disappearing all throughout the world, leaving the future of much of the world’s food supply in question. The decline of bees could have an enormous impact on the environment, which is dependent on the insects for pollination.
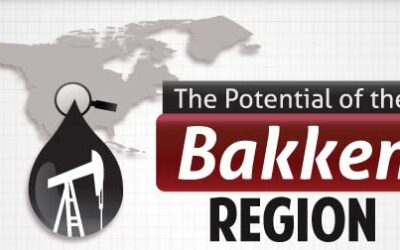
The Potential of the Bakken Region
North Dakota’s Bakken Shale is providing a wealth of new oil production to the U.S., along with bountiful economic activity. The Bakken could be producing as much as a million barrels per day by 2020, and extraction of this oil is benefiting the region and the country through the creation of thousands of jobs.
Solar System – The Sun and 8 Planets
Our solar system is located within the Milky Way – the galaxy that contains more than 200 billion stars. The Sun and 8 planets of the solar system were formed about 4.6 billion years ago. This infographic shows whole solar system as well as planets’ physical characteristics and their position inside the system.
Fossil Fuels, Alternatives, and Politics in 2012
Reliance on fossil fuels has been a concern to government and the public for decades. Many want to abolish their use because of pollution, global warming and sustainability projections. Some deny the need for clean energy and reject projections as misinformation. What side is right?
Green Energy and Politics in 2012
Today, many businesses, organizations and even individuals know their carbon footprint just as well as they know their shoe size. Being green, sustainable and eco-conscious is becoming a requirement. But how green are the main green energy alternatives?
Obama’s Green Initiatives & Regulations
The Obama administration has invested over $90 billion in clean energy and is on a path to double renewable energy 2008 levels by the end of 2012. The following infographic from Ambient Bamboo Floors highlights some of the country’s newest green laws and how they can affect you.
Search 12,000+ Infographics!
Partners
Browse Archives By Category
Animated Infographics
Business Infographics
Career & Jobs Infographics
Education Infographics
Entertainment Industry Infographics
Environmental Infographics
Finance & Money Infographics
Food & Drink Infographics
Health Infographics
Historical Infographics
Home & Garden Infographics
Internet Infographics
Law and Legal Infographics
Lifestyle Infographics
Marketing Infographics
Offbeat Infographics
Parenting Infographics
Pets & Animals Infographics
Political Infographics
Shopping Infographics
Sports and Athletic Infographics
Technology Infographics
Transportation Infographics
Travel Infographics
Video Infographics


