Environmental Infographics
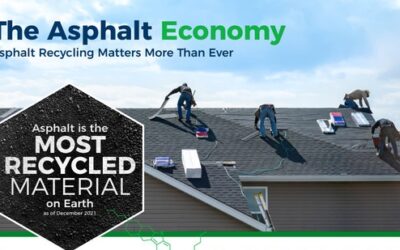
The Asphalt Economy: Recycling Matters More Than Ever
It’s time to think more about the uses of asphalt in the world. Not only is it the most recycled material on earth, but it is a 100% renewable construction resource. Learn more about the asphalt economy.
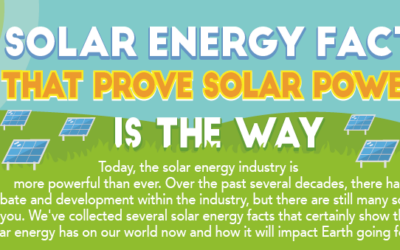
30 Solar Energy Facts That Prove Solar Power is the Way
There are many benefits to solar energy, and today, the solar energy industry is more powerful than ever. Over the past several decades, there has been much debate and development within the industry, but there are also many solar energy facts that may surprise you. In the following infographic, discover 30 solar energy facts that prove solar power is the way.
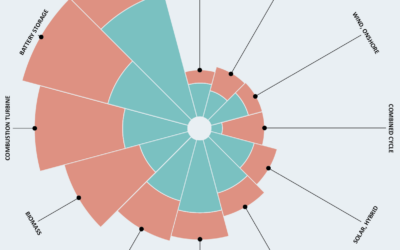
Types of Energy Ranked by Cost Per Megawatt Hour
As prices continuously rise and the planet edges closer to the brink of calamity, many people are wondering what the cheapest energy for the home is. The share of renewables in global energy generation reached nearly 28% in 2020 and is projected to approach 49% by 2050, according to the U.S. Energy Information Administration.

7 Sustainable Ideas for Eco-Entrepreneurs to Know About
In the past, people used to be proud of their individual contributions and what they could offer society. They wanted to make a difference in whatever way they could. These days, however, there isn’t always an opportunity for each person to do something significant as a lot of people feel like they’re just along for the ride.

The 20 Largest Solar Power Plants in the World
Here is a circular bar graph that represents the largest solar power plants around the globe. 7 out of the top 20 largest plants (including the worlds largest) are located in India. Solar power is the fastest growing green energy worldwide and these power plants are just the beginning of what the future might hold.

Top 30 Universities That Use the Most Green Energy
Cambridge International’s first ever Global Perspectives survey discovered that many youths are concerned about the future of the planet. Of the more than 11,000 students aged 13 to 19 surveyed, 96% agreed that global issues should be addressed in school. This infographic can help students choose the top green colleges in the U.S.
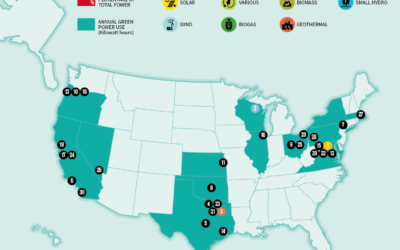
Top 30 Local Government Entities That Use the Most Green Energy
This visual map shows which government entities in the U.S. care about their carbon footprint the most. These top 30 companies have made substantial strides toward renewable energy with some providing more than 100% clean energy like the District of Columbia.

What Could Be in Floodwaters?
Floodwaters have some of the worst water quality ratings, carrying a toxic soup of contaminants. Across Mississippi, Alabama, Tennessee, and Georgia, the threat of flooding makes it essential for your safety to understand what could be in your floodwaters. Below, the team at AFS breaks down the most common floodwater contaminants, their health consequences, and what you can do to stay safe during a flood.
The Environmental Impact of Bitcoin
The discussion about the environmental impact of cryptocurrencies – and Bitcoin, specifically – isn’t new, but recent remarks by none other than Elon Musk have given some more notoriety to the issue. That’s why the team at Casinos Blockchain have gathered data from authoritative sources about the environmental impact of Bitcoin and turned it into a helpful infographic.
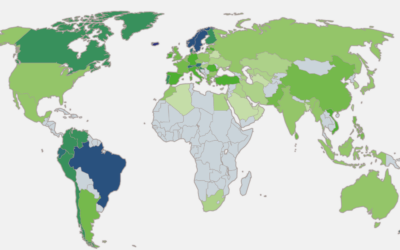
Countries With the Largest Shares of Renewable and Solar Energy
This visual graph from SolarPower.Guide shows places in the world with the highest shares of primary energy from renewable sources as of 2019. You can see the biggest leaders that have a share over 35% as of 2019 are Iceland, Norway, Brazil, Sweden, and New Zealand.
The Asphalt Economy: Recycling Matters More Than Ever
It’s time to think more about the uses of asphalt in the world. Not only is it the most recycled material on earth, but it is a 100% renewable construction resource. Learn more about the asphalt economy.
30 Solar Energy Facts That Prove Solar Power is the Way
There are many benefits to solar energy, and today, the solar energy industry is more powerful than ever. Over the past several decades, there has been much debate and development within the industry, but there are also many solar energy facts that may surprise you. In the following infographic, discover 30 solar energy facts that prove solar power is the way.
Types of Energy Ranked by Cost Per Megawatt Hour
As prices continuously rise and the planet edges closer to the brink of calamity, many people are wondering what the cheapest energy for the home is. The share of renewables in global energy generation reached nearly 28% in 2020 and is projected to approach 49% by 2050, according to the U.S. Energy Information Administration.
7 Sustainable Ideas for Eco-Entrepreneurs to Know About
In the past, people used to be proud of their individual contributions and what they could offer society. They wanted to make a difference in whatever way they could. These days, however, there isn’t always an opportunity for each person to do something significant as a lot of people feel like they’re just along for the ride.
The 20 Largest Solar Power Plants in the World
Here is a circular bar graph that represents the largest solar power plants around the globe. 7 out of the top 20 largest plants (including the worlds largest) are located in India. Solar power is the fastest growing green energy worldwide and these power plants are just the beginning of what the future might hold.
Top 30 Universities That Use the Most Green Energy
Cambridge International’s first ever Global Perspectives survey discovered that many youths are concerned about the future of the planet. Of the more than 11,000 students aged 13 to 19 surveyed, 96% agreed that global issues should be addressed in school. This infographic can help students choose the top green colleges in the U.S.
Top 30 Local Government Entities That Use the Most Green Energy
This visual map shows which government entities in the U.S. care about their carbon footprint the most. These top 30 companies have made substantial strides toward renewable energy with some providing more than 100% clean energy like the District of Columbia.
What Could Be in Floodwaters?
Floodwaters have some of the worst water quality ratings, carrying a toxic soup of contaminants. Across Mississippi, Alabama, Tennessee, and Georgia, the threat of flooding makes it essential for your safety to understand what could be in your floodwaters. Below, the team at AFS breaks down the most common floodwater contaminants, their health consequences, and what you can do to stay safe during a flood.
The Environmental Impact of Bitcoin
The discussion about the environmental impact of cryptocurrencies – and Bitcoin, specifically – isn’t new, but recent remarks by none other than Elon Musk have given some more notoriety to the issue. That’s why the team at Casinos Blockchain have gathered data from authoritative sources about the environmental impact of Bitcoin and turned it into a helpful infographic.
Countries With the Largest Shares of Renewable and Solar Energy
This visual graph from SolarPower.Guide shows places in the world with the highest shares of primary energy from renewable sources as of 2019. You can see the biggest leaders that have a share over 35% as of 2019 are Iceland, Norway, Brazil, Sweden, and New Zealand.
Search 12,100+ Infographics!
Partners


Browse Archives By Category
Animated Infographics
Business Infographics
Career & Jobs Infographics
Education Infographics
Entertainment Industry Infographics
Environmental Infographics
Finance & Money Infographics
Food & Drink Infographics
Health Infographics
Historical Infographics
Home & Garden Infographics
Internet Infographics
Law and Legal Infographics
Lifestyle Infographics
Marketing Infographics
Offbeat Infographics
Parenting Infographics
Pets & Animals Infographics
Political Infographics
Shopping Infographics
Sports and Athletic Infographics
Technology Infographics
Transportation Infographics
Travel Infographics
Video Infographics