Environmental Infographics
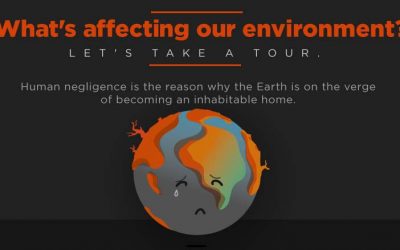
What’s Affecting Our Environment?
The negligence of human civilization is creating havoc in the environment. Not one, not two, but in this infographic, Infographic Design Team highlights five of those issues that are slowly pushing Earth on the verge of death. They also explain how we can reverse the ill-effects of human negligence on nature.
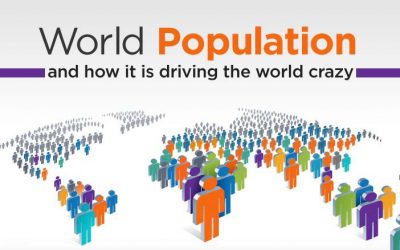
World Population: How It Is Driving the World Crazy
Everything needs balance to sustain for a longer time. In the case of the human population as well, the growth has to be optimal. Here is an infographic from Infographic Design Team which comprises of the details of the latest population trends.

Game On: How Hunting Helps Conservation
Hunters are among some of the most ardent conservationists due to the fact that they support programs that help maintain species populations and protected habitat for wildlife. In this infographic, Davis 5 Ranch takes a look at the benefits that come from hunting for sport and the effect they have on wildlife conservation throughout the United States.
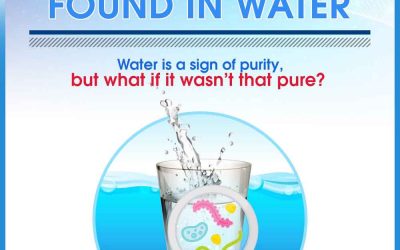
Hidden Contaminants Found in Water
In countless forms and occurrences, we encounter water throughout our day-to-day lives. It’s in our food and drinks, our plumbing, our industrial processes, our weather, and even our very bodies. However, working with water doesn’t necessarily mean you’re working with clean, pure water. Even this most crucial resource for living can be tainted by a number of contaminants.
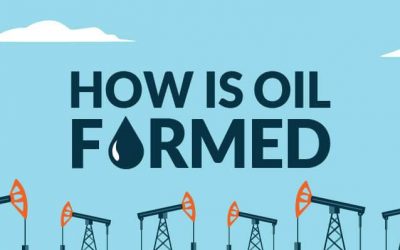
How Oil is Formed
Oil is one of the most valuable resources on the planet because of our use of it in our cars, homes and a variety of other products. In fact, we in the U.S. use over 19 million barrels of oil a day! This infographic details how oil was formed, and why it’s important to use it in a responsible manner as our population grows.
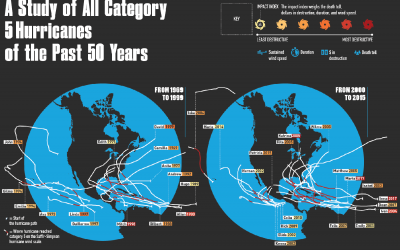
Category 5 Hurricanes of the Past 50 Years
This infographic explores all of the Category 5 hurricanes of the last 50 years. They are also ranked in terms of the amount of damage done to humans. This “Human Impact Index” includes data such as death toll, wind speed, and more. A map view offers a visual representation of each hurricane’s storm tracking, and a chart shows the amount of destruction caused by each hurricane (in USD).
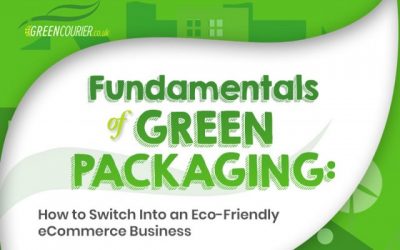
Fundamentals of Green Packaging
Meeting your environmental responsibilities as a business – regardless of your platform – is more pressing than ever, what with the increasing number of consumers who are making the switch into green living. If you want to tap into this growing market, then operating a green e-commerce business is the only way to go. The following infographic will guide you through the other ways you can make the switch into an eco-conscious e-commerce business.

60 Thrifty Ways to Help Save the Planet
Earth Day isan annual worldwide event that advocates for the preservation and protection of the planet and all of its inhabitants. This includes taking steps to reduce our carbon footprint, cutting down on plastic pollution, and recycling as much as we can. This infographic provides 60 small, simple ways to live a more sustainable life as a family and on an individual level.
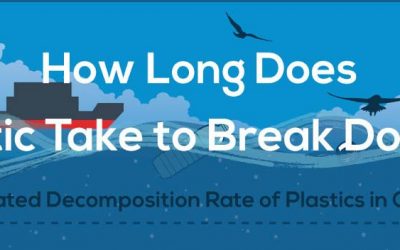
How Long Does It Take Plastic To Break Down In The Ocean?
This infographic by AlansFactoryOutlet.com takes a hard look at how long several types of plastics take to fully break down once they are dumped into the world’s oceans. Plastics do not “biodegrade.” Instead, they degrade from sunlight exposure. However, when dumped into the ocean, they are not exposed to sunlight.
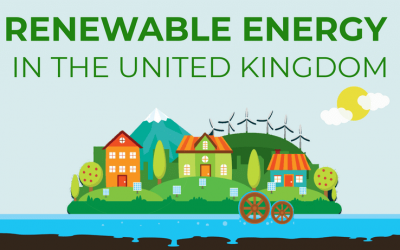
Renewable Energy in the United Kingdom
Renewable energy in the United Kingdom has had an explosive growth over the past decade. Recent reports show that 30% of their total electricity generation can be attributed to renewable sources. Scotland comes out of 2016 as the best region with close to 50% of their electricity generation coming from renewable sources. In the following infographic, learn more about renewable energy in the UK.
Search 11,800+ Infographics!
Partners


Browse Archives By Category
Animated Infographics
Business Infographics
Career & Jobs Infographics
Education Infographics
Entertainment Industry Infographics
Environmental Infographics
Finance & Money Infographics
Food & Drink Infographics
Health Infographics
Historical Infographics
Home & Garden Infographics
Interactive Infographics
Internet Infographics
Law and Legal Infographics
Lifestyle Infographics
Marketing Infographics
Offbeat Infographics
Parenting Infographics
Pets & Animals Infographics
Political Infographics
Shopping Infographics
Sports and Athletic Infographics
Technology Infographics
Transportation Infographics
Travel Infographics
Video Infographics