Finance & Money Infographics

How to Stay on Top of Your Payment Plans
Paying bills on time is important because it impacts other areas of your finances including raising your credit score and saving money by not paying interest or late fees. Maintaining a payment schedule can be easily done by taking certain actions in your daily life. In this infographic, discover everything you need to know when it comes to staying disciplined, and making your car payments on time.
Taking Control Of Your Energy Bill
Energy bills are necessary and they are also widely variable. So what if you could cut your power usage to ensure you are only using what you need and not paying for what you don’t? Check out this infographic for more information.
The Wealth of U.S. Presidents
How much are past and current U.S Presidents actually worth in today’s dollars? While only one has reached billionaire status, many of them ended up being millionaires. This infographic ranks each of the presidents by their net worth in 2016 U.S. dollars, as well as the annual presidential salary during their time in office.

40 Small Ways to Save Money
The average American has less than $5,000 in their bank account, and very few are prepared for a financial emergency. This infographic by TitleMax.com is meant to be a useful tool to help people start saving money and lists 40 small ways to save money.
Navigating the Pitfalls of Payday Loans
Twelve million Americans rely on payday loans each year to manage income volatility or handle unexpected emergencies. Unfortunately, many people fall victim to predatory lenders. This infographic lists the most common pitfalls of payday loans and shows the steps consumers can take to avoid them.
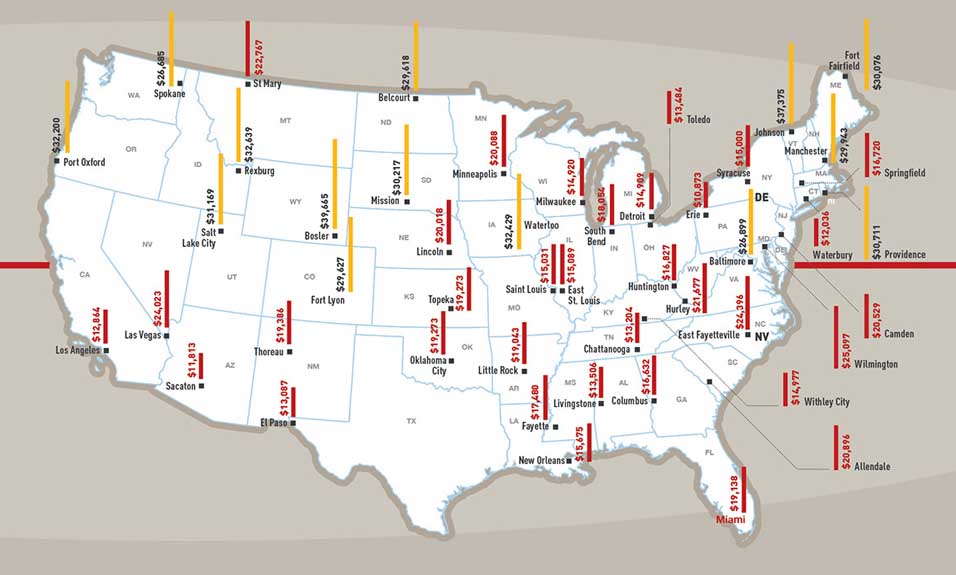
The Poorest ZIP Codes in America
This infographic uses the U.S. Census Bureau data to visualize the poorest zip codes in the entire country. A zip code in Erie, Pennsylvania is the poorest of them all, with a median income of $10,873 and a mean income of $14,780. To put that into perspective, consider that the U.S. Department of Health and Human Services states that the federal poverty level for a family of four is $25,100 and for an individual is $12,140!
History’s Wealthiest & How Much They Would Be Worth Today
The team at TitleMax.com calculated what the world’s richest people of past would’ve made in today’s dollars. In some cases, it is trillions! Using expert estimates and adjusting for inflation, these are the top earners in the world who have ever lived. You’ve got a long way to go, Jeff Bezos.
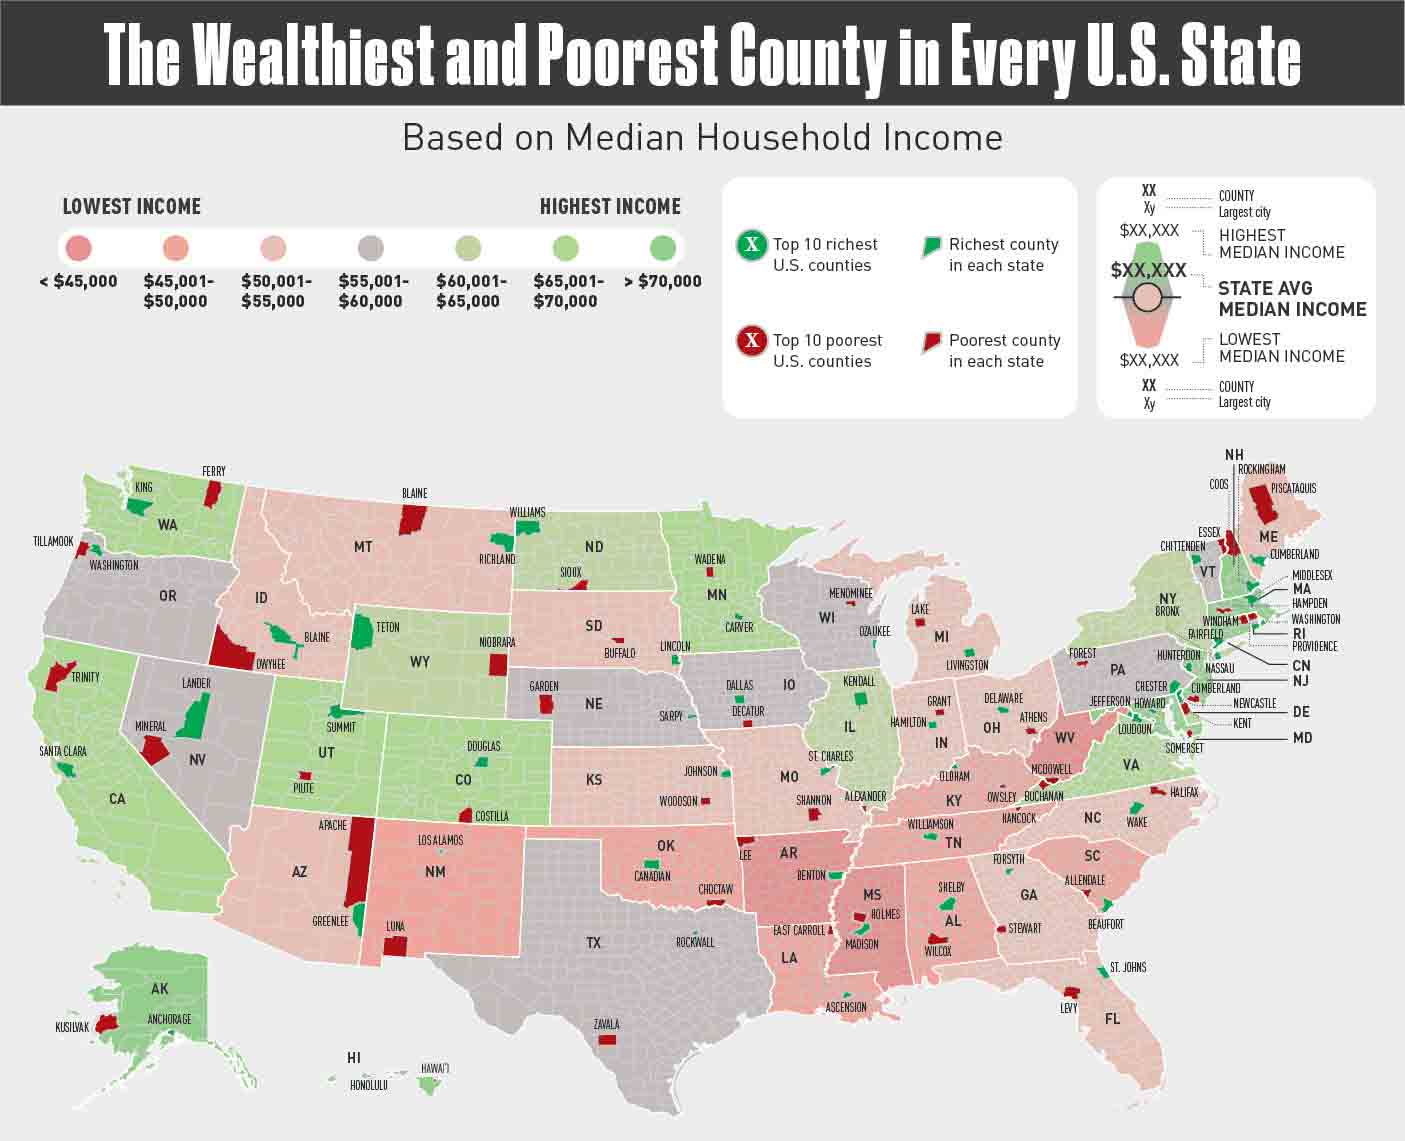
The Wealthiest and Poorest County in Every U.S. State
Virginia is home to the country’s wealthiest county (Loudoun, VA) but also the biggest in-state wealth disparity between its wealthiest and poorest counties. This infographic takes a deep dive into the poorest and wealthiest counties in the U.S., looking closely at each state’s median income on the county level, and the data is pretty surprising.
The Median Debt of Americans
Debt has become a humongous financial burden to many Americans as they are weighed down by mortgages, student loans, auto loans, and credit card debt. But just how much debt are Americans really in? This infographic breaks down the median debt of Americans based on various demographics such as their age, education level, race/ethnicity, occupation, family structure, and even their debt by net worth.
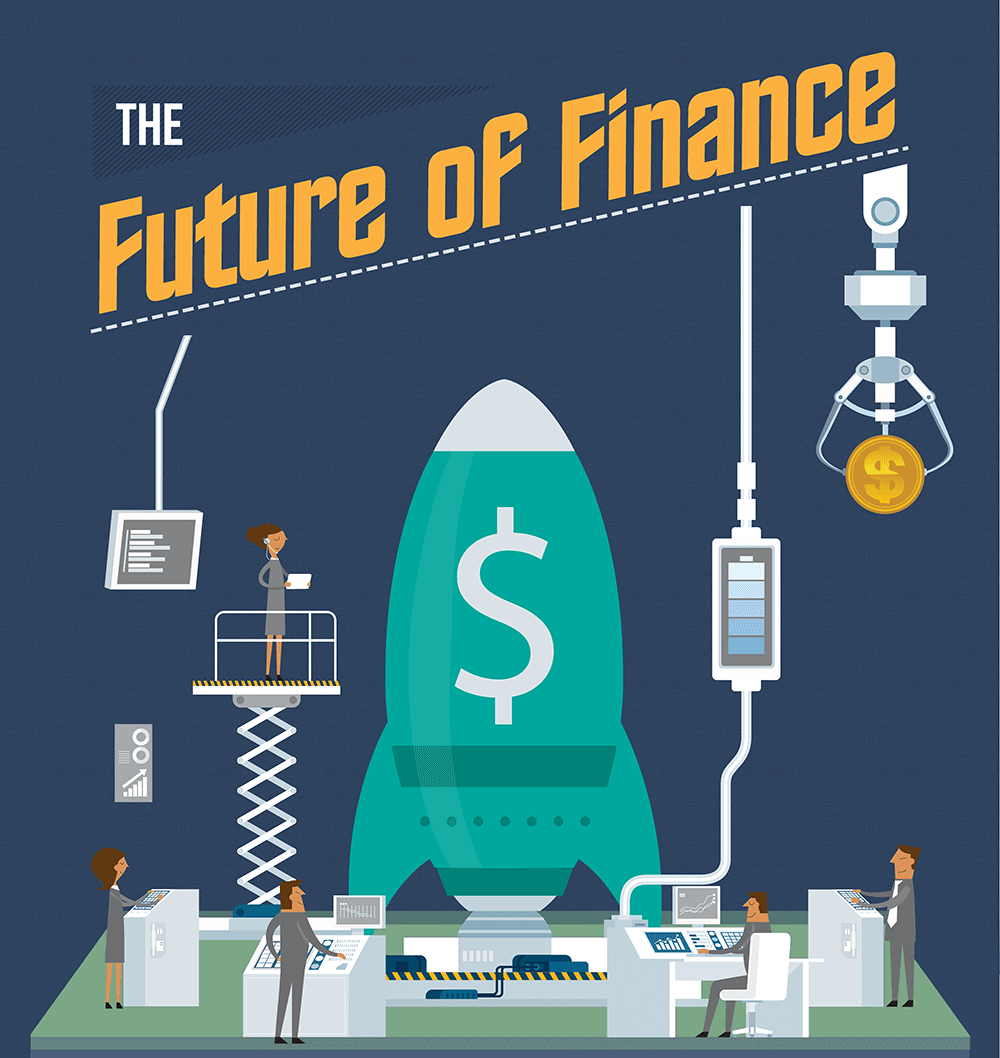
The Future of Finance
Technology has impacted virtually every industry, particularly the financial sector. Whether it’s the development of new forms of currency or expanding how and where investors can trade, the financial industry is evolving at an unprecedented rate. Mobile apps, online lending platforms, and smaller, more agile organizations are successfully competing with large, established firms.
How to Stay on Top of Your Payment Plans
Paying bills on time is important because it impacts other areas of your finances including raising your credit score and saving money by not paying interest or late fees. Maintaining a payment schedule can be easily done by taking certain actions in your daily life. In this infographic, discover everything you need to know when it comes to staying disciplined, and making your car payments on time.
Taking Control Of Your Energy Bill
Energy bills are necessary and they are also widely variable. So what if you could cut your power usage to ensure you are only using what you need and not paying for what you don’t? Check out this infographic for more information.
The Wealth of U.S. Presidents
How much are past and current U.S Presidents actually worth in today’s dollars? While only one has reached billionaire status, many of them ended up being millionaires. This infographic ranks each of the presidents by their net worth in 2016 U.S. dollars, as well as the annual presidential salary during their time in office.
40 Small Ways to Save Money
The average American has less than $5,000 in their bank account, and very few are prepared for a financial emergency. This infographic by TitleMax.com is meant to be a useful tool to help people start saving money and lists 40 small ways to save money.
Navigating the Pitfalls of Payday Loans
Twelve million Americans rely on payday loans each year to manage income volatility or handle unexpected emergencies. Unfortunately, many people fall victim to predatory lenders. This infographic lists the most common pitfalls of payday loans and shows the steps consumers can take to avoid them.
The Poorest ZIP Codes in America
This infographic uses the U.S. Census Bureau data to visualize the poorest zip codes in the entire country. A zip code in Erie, Pennsylvania is the poorest of them all, with a median income of $10,873 and a mean income of $14,780. To put that into perspective, consider that the U.S. Department of Health and Human Services states that the federal poverty level for a family of four is $25,100 and for an individual is $12,140!
History’s Wealthiest & How Much They Would Be Worth Today
The team at TitleMax.com calculated what the world’s richest people of past would’ve made in today’s dollars. In some cases, it is trillions! Using expert estimates and adjusting for inflation, these are the top earners in the world who have ever lived. You’ve got a long way to go, Jeff Bezos.
The Wealthiest and Poorest County in Every U.S. State
Virginia is home to the country’s wealthiest county (Loudoun, VA) but also the biggest in-state wealth disparity between its wealthiest and poorest counties. This infographic takes a deep dive into the poorest and wealthiest counties in the U.S., looking closely at each state’s median income on the county level, and the data is pretty surprising.
The Median Debt of Americans
Debt has become a humongous financial burden to many Americans as they are weighed down by mortgages, student loans, auto loans, and credit card debt. But just how much debt are Americans really in? This infographic breaks down the median debt of Americans based on various demographics such as their age, education level, race/ethnicity, occupation, family structure, and even their debt by net worth.
The Future of Finance
Technology has impacted virtually every industry, particularly the financial sector. Whether it’s the development of new forms of currency or expanding how and where investors can trade, the financial industry is evolving at an unprecedented rate. Mobile apps, online lending platforms, and smaller, more agile organizations are successfully competing with large, established firms.
Search 12,100+ Infographics!
Partners


Browse Archives By Category
Animated Infographics
Business Infographics
Career & Jobs Infographics
Education Infographics
Entertainment Industry Infographics
Environmental Infographics
Finance & Money Infographics
Food & Drink Infographics
Health Infographics
Historical Infographics
Home & Garden Infographics
Internet Infographics
Law and Legal Infographics
Lifestyle Infographics
Marketing Infographics
Offbeat Infographics
Parenting Infographics
Pets & Animals Infographics
Political Infographics
Shopping Infographics
Sports and Athletic Infographics
Technology Infographics
Transportation Infographics
Travel Infographics
Video Infographics