Finance & Money Infographics

What Is A Reverse Mortgage?
In this infographic from aag.com, learn the essential reverse mortgage information for seniors such as: What is a reverse mortgage loan, how does a reverse mortgage work, how do they help seniors, and are they safe?

Unlocking the Power Of Your Lease
It might sound like a prank call or even a scam – someone from some company you’ve never heard from telling you that they want to rent a portion of your land to install a cellular tower or a billboard for good money. Preliminary research, however, will show that the company is legitimate, and so is their money.
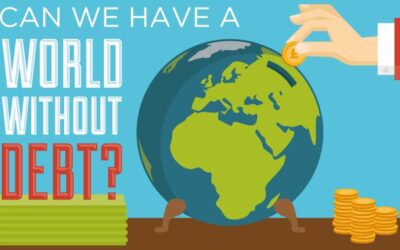
Can We Have a World Without Debt?
A lot of people are forced to live in a debt from day to day. Can you even imagine the world where debt isn’t an option? Find out more about it in this intriguing infographic by the folks at PayPlan.
A Look At Forex Trading
Forex, a combination of two words foreign and exchange, is simply a process in which the exchange of foreign currencies is done. Known with one more name ‘FX’, Forex has become the world’s most traded market, with a turnover of several trillions per day. This infographic takes a visual look at Forex trading.

Credit Card Chips: Everything You Need To Know
Here is an infographic that is designed to help users understand the transition to EMV smart chip credit cards. It covers topics such as, what is a chip card, how do I use it, why is it better, chip card tips and more.
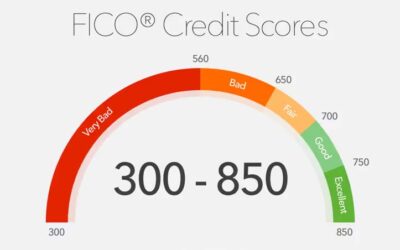
Why Credit Scores Are Important
Credit scores play central role in the sphere of lending. Banks and other traditional loan places are unwilling to grant loans to borrowers with bad credit. However, it is not easy sometimes to keep your credit score fine and intact but it is very advisable to try your best in doing so.
U.S. Economy at a Glance
We live in a globalized world where virtually all countries interact with each other. As a result the economy has become increasingly complex. Despite this, it is important to know what is going on in the world around you. Here’s an infographic that illustrates the most important facts and figures about the US economy at a glance.

Student Loan Forgiveness: Discharge or the Other
There are certain type of loans a student can borrow to study. At the same time there are many different options available for student loan forgiveness and discharge. The following infographic examines these more closely.

The Most Expensive Insurance Claims of All Time
This infographic explores some of the largest pay-outs the world has ever seen, and looks at a wide range of areas like motor and even pet insurance.
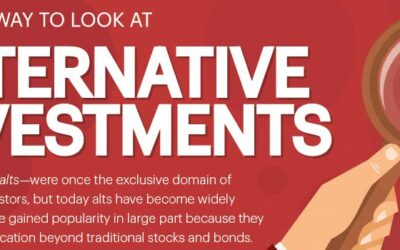
A New Way To Look At Alternative Investments
Alternative investments can help you diversify your financial portfolio. Learn more about alternative investments in this infographic by the folks at ProShares.
What Is A Reverse Mortgage?
In this infographic from aag.com, learn the essential reverse mortgage information for seniors such as: What is a reverse mortgage loan, how does a reverse mortgage work, how do they help seniors, and are they safe?
Unlocking the Power Of Your Lease
It might sound like a prank call or even a scam – someone from some company you’ve never heard from telling you that they want to rent a portion of your land to install a cellular tower or a billboard for good money. Preliminary research, however, will show that the company is legitimate, and so is their money.
Can We Have a World Without Debt?
A lot of people are forced to live in a debt from day to day. Can you even imagine the world where debt isn’t an option? Find out more about it in this intriguing infographic by the folks at PayPlan.
A Look At Forex Trading
Forex, a combination of two words foreign and exchange, is simply a process in which the exchange of foreign currencies is done. Known with one more name ‘FX’, Forex has become the world’s most traded market, with a turnover of several trillions per day. This infographic takes a visual look at Forex trading.
Credit Card Chips: Everything You Need To Know
Here is an infographic that is designed to help users understand the transition to EMV smart chip credit cards. It covers topics such as, what is a chip card, how do I use it, why is it better, chip card tips and more.
Why Credit Scores Are Important
Credit scores play central role in the sphere of lending. Banks and other traditional loan places are unwilling to grant loans to borrowers with bad credit. However, it is not easy sometimes to keep your credit score fine and intact but it is very advisable to try your best in doing so.
U.S. Economy at a Glance
We live in a globalized world where virtually all countries interact with each other. As a result the economy has become increasingly complex. Despite this, it is important to know what is going on in the world around you. Here’s an infographic that illustrates the most important facts and figures about the US economy at a glance.
Student Loan Forgiveness: Discharge or the Other
There are certain type of loans a student can borrow to study. At the same time there are many different options available for student loan forgiveness and discharge. The following infographic examines these more closely.
The Most Expensive Insurance Claims of All Time
This infographic explores some of the largest pay-outs the world has ever seen, and looks at a wide range of areas like motor and even pet insurance.
A New Way To Look At Alternative Investments
Alternative investments can help you diversify your financial portfolio. Learn more about alternative investments in this infographic by the folks at ProShares.
Search 12,100+ Infographics!
Partners


Browse Archives By Category
Animated Infographics
Business Infographics
Career & Jobs Infographics
Education Infographics
Entertainment Industry Infographics
Environmental Infographics
Finance & Money Infographics
Food & Drink Infographics
Health Infographics
Historical Infographics
Home & Garden Infographics
Internet Infographics
Law and Legal Infographics
Lifestyle Infographics
Marketing Infographics
Offbeat Infographics
Parenting Infographics
Pets & Animals Infographics
Political Infographics
Shopping Infographics
Sports and Athletic Infographics
Technology Infographics
Transportation Infographics
Travel Infographics
Video Infographics