Finance & Money Infographics

The Cost of Living Like Your Favorite Sitcom Family
How much does it cost your favorite sitcom families to live their day-to-day lives? The team at FatWallet went in search of the answers by dissecting The Simpsons, Full House, Family Guy, Rug Rats and more.

The Effects of the Chinese Yuan Devaluation on Global Currencies
On August 11th, 2015, China changed the way the way the reference rate was calculated. This had immediate and long-term effects on the exchange rates of just about every currency. The following infographic shows the devaluation of the Renminbi against other currencies after 24-hours, 1-week and 1-month since the devaluation on August 11th.
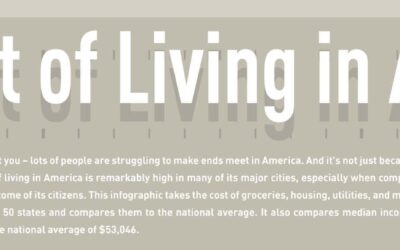
The Cost of Living in America
This infographic takes the cost of living and compares it to the median income across 129 cities, across all 50 states in America. The cost of living is calculated as a composite index – meaning it takes the cost of things like groceries, healthcare, transportation, and other daily costs and factors them together.

Who Gets Paid When a Company Goes Bust
This infographic from Company Rescue shows the priority of payments for people owed money when a business goes bust. It includes the employees, tax authorities, banks, shareholders and insolvency practitioners.
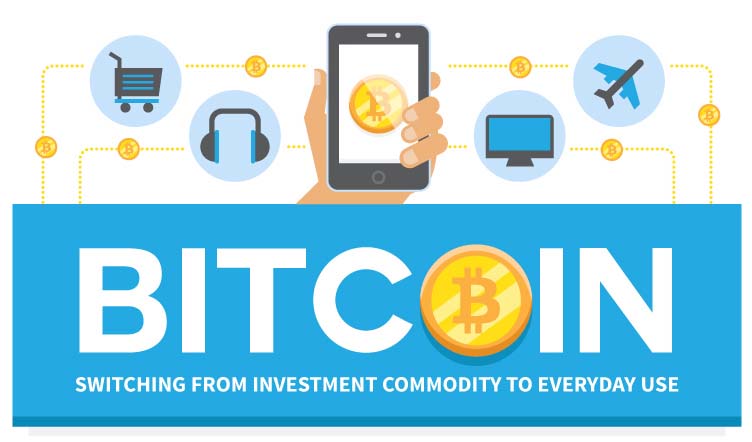
Bitcoin: Switching from Investment Commodity to Everyday Use
Bitcoin is quickly switching from “an investment commodity to everyday use” and Coupofy has enough data points in the following infographic to prove it.

Understanding EMV Technology
Do you know what a chip-enabled credit card is, how EMV technology works and how to make sure that your credit card is chip-enabled? Well look no further. This infographic by CompareCards.com will provide you with all of the information that you will need to answer those questions.

Why Millennials Don’t Sweat the Student Loan Debt
Millennials may be spending more for college and racking up record debt, but they don’t mind, according to a new survey of 500 university graduates. See what Millennials are doing to not sweat the big stuff with this insightful infographic, put together by the folks at CreditSesame.com.

5 Myths About Your Credit Score
If you’re hoping to improve your credit score, learning exactly how the system works is the first step. Understanding the truth about what impacts your credit score will help you plan to reach your goals. In this infographic, Community First Credit Union dispels five popular myths about credit ratings.
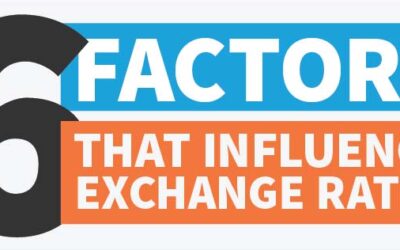
Factors That Influence Exchange Rates
Most people get confused by exchange rates. Nobody really knows why they change so often. In this informative infographic you will learn which factors influence these changes.

The World’s Top 20 Billionaires (2015)
The Story Worth 900 Billions – This infographic shows the “Crème de la crème” – the very top of the 20 richest people in the world, including their net worth, demographic stats and how they utilize their wealth for public good. This is the story about the richest people in the world.
The Cost of Living Like Your Favorite Sitcom Family
How much does it cost your favorite sitcom families to live their day-to-day lives? The team at FatWallet went in search of the answers by dissecting The Simpsons, Full House, Family Guy, Rug Rats and more.
The Effects of the Chinese Yuan Devaluation on Global Currencies
On August 11th, 2015, China changed the way the way the reference rate was calculated. This had immediate and long-term effects on the exchange rates of just about every currency. The following infographic shows the devaluation of the Renminbi against other currencies after 24-hours, 1-week and 1-month since the devaluation on August 11th.
The Cost of Living in America
This infographic takes the cost of living and compares it to the median income across 129 cities, across all 50 states in America. The cost of living is calculated as a composite index – meaning it takes the cost of things like groceries, healthcare, transportation, and other daily costs and factors them together.
Who Gets Paid When a Company Goes Bust
This infographic from Company Rescue shows the priority of payments for people owed money when a business goes bust. It includes the employees, tax authorities, banks, shareholders and insolvency practitioners.
Bitcoin: Switching from Investment Commodity to Everyday Use
Bitcoin is quickly switching from “an investment commodity to everyday use” and Coupofy has enough data points in the following infographic to prove it.
Understanding EMV Technology
Do you know what a chip-enabled credit card is, how EMV technology works and how to make sure that your credit card is chip-enabled? Well look no further. This infographic by CompareCards.com will provide you with all of the information that you will need to answer those questions.
Why Millennials Don’t Sweat the Student Loan Debt
Millennials may be spending more for college and racking up record debt, but they don’t mind, according to a new survey of 500 university graduates. See what Millennials are doing to not sweat the big stuff with this insightful infographic, put together by the folks at CreditSesame.com.
5 Myths About Your Credit Score
If you’re hoping to improve your credit score, learning exactly how the system works is the first step. Understanding the truth about what impacts your credit score will help you plan to reach your goals. In this infographic, Community First Credit Union dispels five popular myths about credit ratings.
Factors That Influence Exchange Rates
Most people get confused by exchange rates. Nobody really knows why they change so often. In this informative infographic you will learn which factors influence these changes.
The World’s Top 20 Billionaires (2015)
The Story Worth 900 Billions – This infographic shows the “Crème de la crème” – the very top of the 20 richest people in the world, including their net worth, demographic stats and how they utilize their wealth for public good. This is the story about the richest people in the world.
Search 12,100+ Infographics!
Partners


Browse Archives By Category
Animated Infographics
Business Infographics
Career & Jobs Infographics
Education Infographics
Entertainment Industry Infographics
Environmental Infographics
Finance & Money Infographics
Food & Drink Infographics
Health Infographics
Historical Infographics
Home & Garden Infographics
Internet Infographics
Law and Legal Infographics
Lifestyle Infographics
Marketing Infographics
Offbeat Infographics
Parenting Infographics
Pets & Animals Infographics
Political Infographics
Shopping Infographics
Sports and Athletic Infographics
Technology Infographics
Transportation Infographics
Travel Infographics
Video Infographics