Lifestyle Infographics
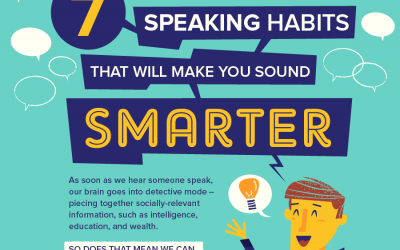
7 Speaking Habits That Will Make You Sound Smarter
As soon as we hear somebody speak, our brains go into detective mode - piercing together socially-relevant information about the speaker such as their intelligence, education, and wealth. Does that mean that we can sound smarter than we actually are? This infographic...
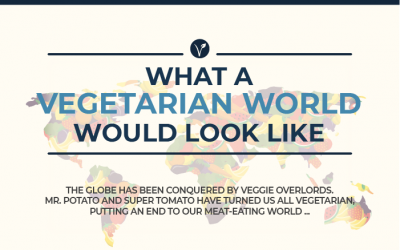
What a Vegetarian World Would Look Like
Vegetarianism has become a growing sensation in the West, particularly among North Americans, Europeans, and Australians. Meanwhile in other parts of the world, like India and China, meat consumption is on the rise. But what if, in some parallel universe, the entirety of the human race turned vegetarian overnight? Berlin based startup MEDIGO decided make an infographic that explores what a vegetarian world might look like.

Ultimate How-To Guide for ‘90s Hairstyles
Are you nostalgic for the ‘90s? For Gen Xers, it was a decade when shows like Friends and Sex in the City was on television. TV characters Carrie Bradshaw and Rachel Green were certainly style icons, but there were other hairstyles worn by musicians and movie stars that became classic ‘90s looks. These five retro hairstyles featured are the ultimate throwback to a time before selfies.
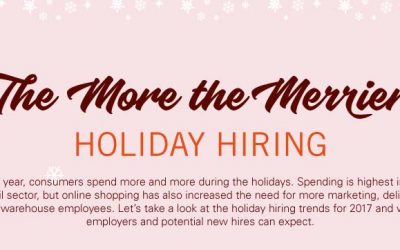
The More the Merrier: Holiday Hiring
Each year, consumers spend more and more during the holidays. Spending is highest in the retail sector, but online shopping has also increased the need for more marketing, delivery, and warehouse employees. The following infographic takes a look at the holiday hiring trends in 2017 and what employers and potential new hires could expect.
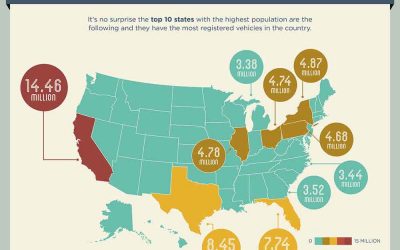
Time in Traffic Generates Unexpected Financial Loss
The typical American will spend about 239 hours behind the wheel each year, so it’s no surprise that traffic congestion can cost money. This infographic from CJ Pony Parts explores the financial losses that people feel on both the state and individual level.

Your Life In Numbers
Have you ever wondered how much of your life is spent sleeping? What about eating? The following infographic by Sleep Matters Club takes a look at our lives and divides up the main things we all do: sleep, work, eat, watch television, socialize, go to school and so on. What’s left at the end is a precious amount of time for you to spend enjoying life, but how much time is that?

How to Plan a Wedding in Greece
If you have ever desired to get married in Greece, here is an infographic from the folks at Santorini Weddings that provides extensive informative on planning a wedding in Greece.
What It Means To Make It In America In 2018
2017 was a bleak year for some. No doubt, our society is going through growing pains. But when it comes to individual lives, there’s happy news to report. Thermosoft Corp recently surveyed 2,000 Americans about work, friends and family, lifestyle, and the things they seek in order to feel they’ve “made it.”
Extreme New Years Resolutions 2018
January, the start of a new year, also means the starting another round of new year’s resolutions. If you, like many others, regularly fail at your set goals then why not try something a little different, bordering on extreme to keep you interested in completing your goal? The team at MyOffers have put together a list to inspire something a little different.
New Years Resolutions: How Does the Nation Fair
It’s a good time for many of us to start afresh and think about what we would like to achieve in the new year. Unfortunately, the very idea of making a New Year’s Resolution could bring back depressing memories, as many of us struggle to meet aims that we set for ourselves. In the following infographic, Low.ie compares the Irish to the British and who is better at keeping New Year’s resolutions.
Search 11,800+ Infographics!
Partners


Browse Archives By Category
Animated Infographics
Business Infographics
Career & Jobs Infographics
Education Infographics
Entertainment Industry Infographics
Environmental Infographics
Finance & Money Infographics
Food & Drink Infographics
Health Infographics
Historical Infographics
Home & Garden Infographics
Interactive Infographics
Internet Infographics
Law and Legal Infographics
Lifestyle Infographics
Marketing Infographics
Offbeat Infographics
Parenting Infographics
Pets & Animals Infographics
Political Infographics
Shopping Infographics
Sports and Athletic Infographics
Technology Infographics
Transportation Infographics
Travel Infographics
Video Infographics