Lifestyle Infographics
Best Places for Men to Meet Women
Dating and meeting others doesn’t only have to be done on online apps. In fact, did you know that women prefer the workplace as a place to meet men more so than bars, the grocery store or the gym? Gotham Dating has interviewed 1,400 of its members (male and female) to find out the top 102 locations for men to pick up (or meet) single women.
Technical Awards at the Oscars
The Oscars’ technical awards celebrate and highlight amazing achievements in the movie industry. This infographic from Electronic World showcases some of the best editing and special effects in recent films in a fun, visual and interesting way.
11 Qualities of Super Successful People
There are people who chase after success throughout their lives, but never achieve it. Then there are those who set examples for others by achieving their dreams. The million dollar question here is; what is it that makes some people successful and others not? Is it hard work alone or is it actually all about luck?
How Pornography Affects the Teenage Brain
There is a rising problem of pornography addiction in teens. By viewing sexually pornographic material, teens are susceptible to countless psychological, emotional, and physiological disorders and issues. This infographic is designed to help you better understand the chemical effects that pornography has on teenagers.
The Science of Peer Pressure
Everyone faces the challenges of peer pressure. From childhood, right through to adulthood, both negative and positive effects can be felt. There’s a lot of research and science behind the influence others can have on us, and in this infographic, the team at WoodenToyShop looks at how you can help your child navigate the demands of these everyday pressures.
Which Cities Have the Most Homicides in Each of Our 50 States?
There are many factors that cause homicide numbers to plummet or soar. The California Post has created a simple way to view the most homicides in each of our 50 US states in the following infographic. They also included the top 10 cities with the most homicides....
12 Science-Based Health Benefits of Low-Carb Ketogenic Diets
Thinking about finally taking the big step of changing to a low-carb or ketogenic diet? The thought of learning new recipes, shopping for new ingredients, and giving up old foods that you enjoy can be incredibly daunting. But as it turns out, there is plenty of incentive in the form of remarkable health benefits for low-carb diets.
The Science Behind Eye Color
Do your brown eyes make you excel at tennis? It turns out there’s a lot more to eye color than meets the eye. A person’s eyes can sometimes reveal more than words ever can. Learn more about the science behind eye color in this infographic from Frames Direct.
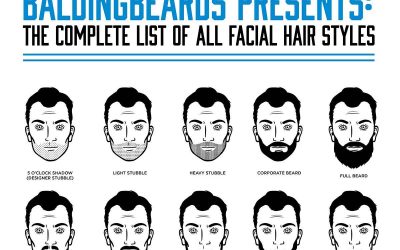
68 Facial Hair Styles for Men
Here’s a chart that provides a basic rundown of every facial hair style. You can use it to guide you as you consider the many options for your facial hair.
16 Types of Camper
From the super efficient camp organizer to the rough and ready caveman camper, Cool of the Wild presents 16 of the most common types of camper in a colorful and humorous infographic.
Search 12,000+ Infographics!
Partners
Browse Archives By Category
Animated Infographics
Business Infographics
Career & Jobs Infographics
Education Infographics
Entertainment Industry Infographics
Environmental Infographics
Finance & Money Infographics
Food & Drink Infographics
Health Infographics
Historical Infographics
Home & Garden Infographics
Internet Infographics
Law and Legal Infographics
Lifestyle Infographics
Marketing Infographics
Offbeat Infographics
Parenting Infographics
Pets & Animals Infographics
Political Infographics
Shopping Infographics
Sports and Athletic Infographics
Technology Infographics
Transportation Infographics
Travel Infographics
Video Infographics


