Lifestyle Infographics
Are You Addicted To Your Mobile Phone?
Cash Generator’s latest research has revealed that we claim to be less addicted to our mobile phones than we were just four years ago – while 87% of people now own a mobile phone, up from 83% in 2011, only a third (32%) confessed to being addicted to their devices, down from half (49%) – despite the fact that smartphone ownership has rocketed from 35% to 77%.

Men’s Dress Codes Made Simple
In this infographic by Samuel Windsor, discover some top tips for men on how to dress correctly. The infographic is aimed at giving men the best chances of dressing appropriately.
Steps on How to Recover from Drugs and Alcohol Addiction
The journey to a healthy, sober life is not an easy one and needs a lifelong commitment and hard work. The specific steps of addiction recovery process will vary according to the addiction, the treatment plan used, and the individual. Learn more about these steps in the following infographic.
Top 16 NBA Careers Destroyed by Drugs
With the late drug charges towards the previous NBA player Lamar Odom, we again remember how risky these drugs are, especially in sports. To give you clear look, here is an infographic about these well-known NBA stars who destroyed their professions by letting drugs control their lives.
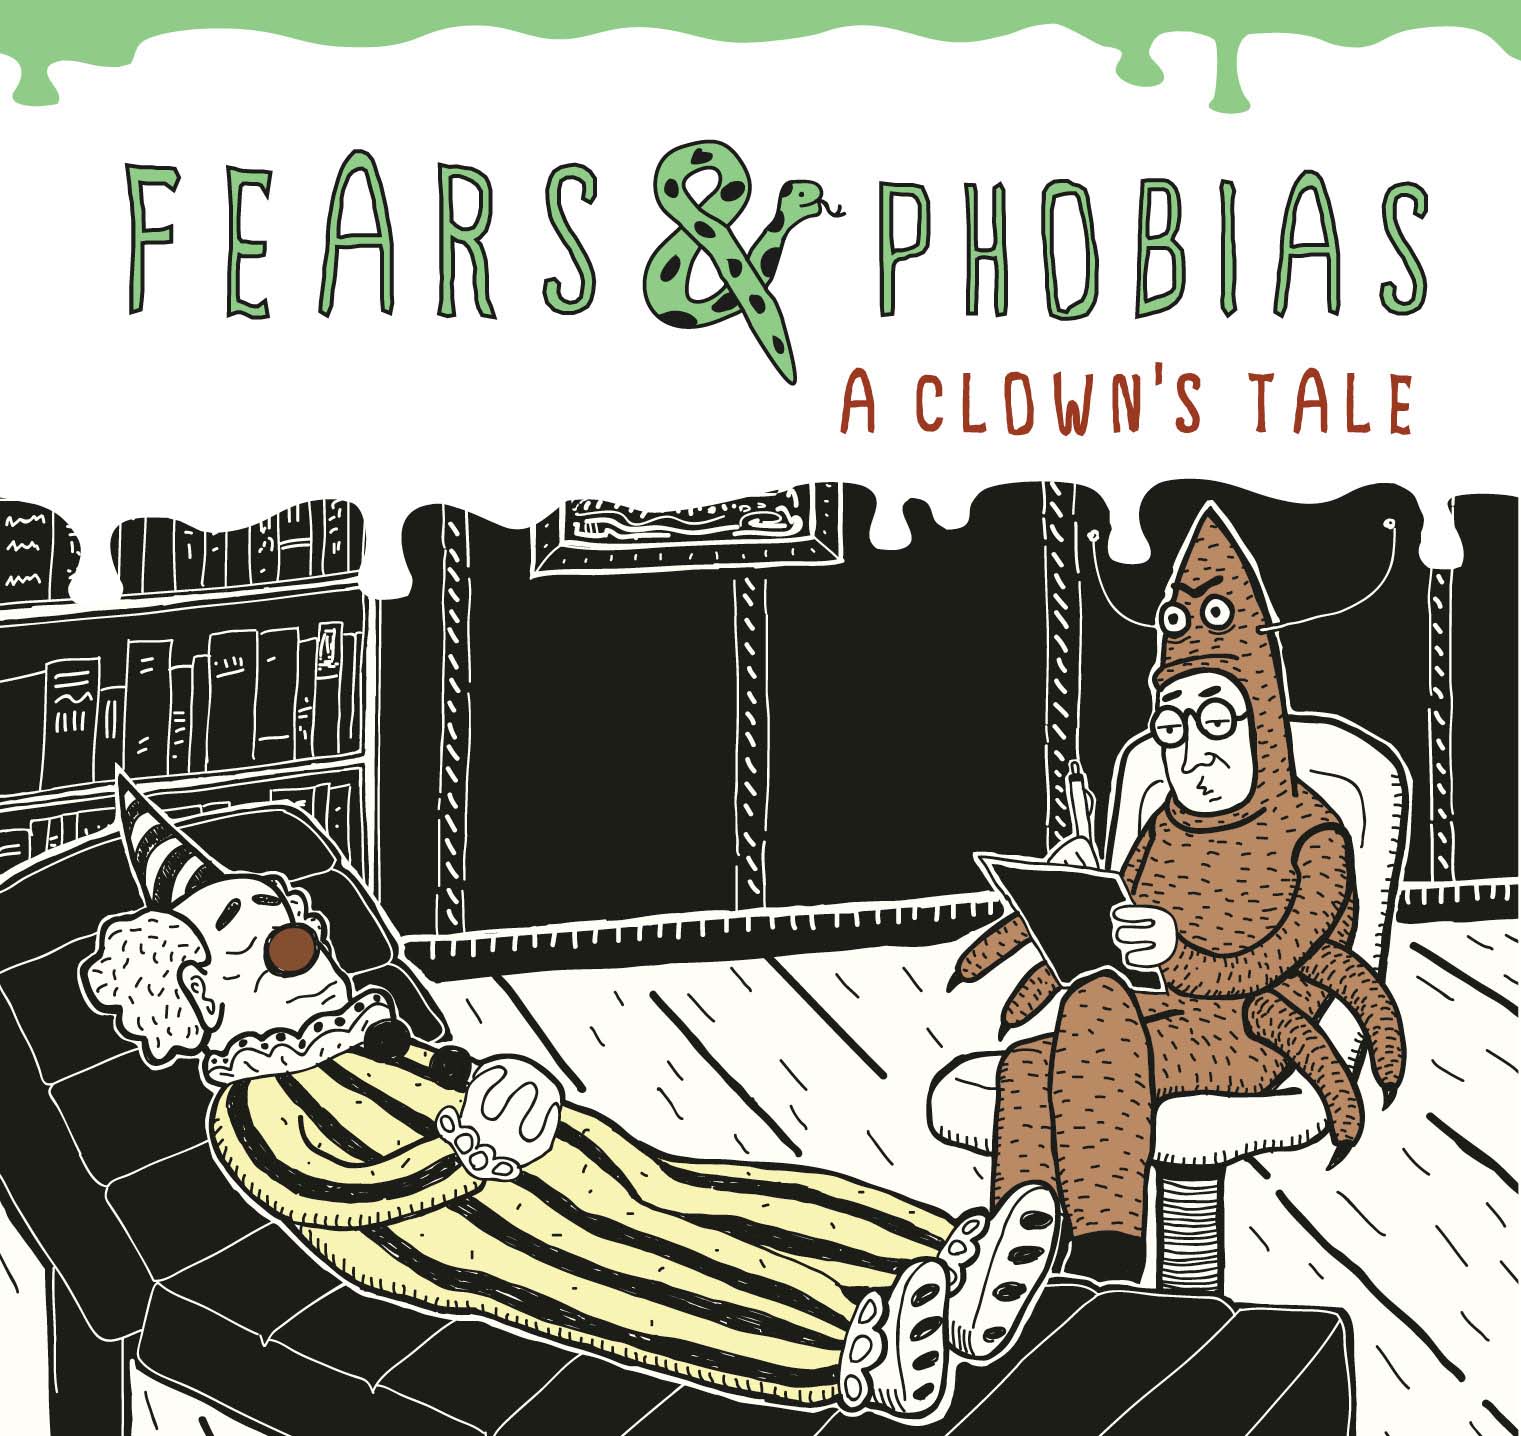
Fears & Phobias: A Clown’s Tale
If you are like 8.7% of adults, then you have a pet nemesis: a phobia. Phobias can be terribly banal, commonplace, and trivial, like the fear of blood, or some hairy, toothy animal. Most people see these things and shrug them off. But if that thing is your phobia, then for you, it’s like the freaking mother of all nasty, slimy, evil ugliness.
2015 Virtual Reality Consumer Report
The VR Consumer Report includes analysis from over 2,282 respondents including kids, millennials, and parents, regarding their preferences for virtual reality products and services. Touchstone Research has compiled some of the key insights from the report into a fun infographic.
Avoid Catfishing Online
No, we’re not talking about fishing in a river. Catfishing is the act of pretending to be someone else to fool someone online. Learn more about protecting yourself from catfishing in this infographic by FreeDating.co.uk.
Baby Boomers Guide To A Five Star Retirement
To fully understand the power and influence of the Baby Boomers, the team at Bluebird Care have produced a fascinating infographic on Baby Boomers in numbers. With tips & advice on how to live a healthy and active lifestyle, both mentally and physically, the infographic shows how easy it is to enjoy the life of a baby boomer as they progress into their golden years.
7 Steps to the Perfect Nap
Napping is an incredible way to boost our health and productivity. Among its many benefits, science has shown that it can enhance our mood, performance, memory and creativity. However, not all naps are created equal. To help you get the most out of your nap (and avoid that unpleasant groggy feeling), Art of Wellbeing has created this 7 step infographic.
How To Find Out What Type of Relationships You Are In?
Everyone wants to know about the seriousness of own relationships. The following infographic will help you to learn more about your partner. To read full article, click on the infographic itself.
Are You Addicted To Your Mobile Phone?
Cash Generator’s latest research has revealed that we claim to be less addicted to our mobile phones than we were just four years ago – while 87% of people now own a mobile phone, up from 83% in 2011, only a third (32%) confessed to being addicted to their devices, down from half (49%) – despite the fact that smartphone ownership has rocketed from 35% to 77%.
Men’s Dress Codes Made Simple
In this infographic by Samuel Windsor, discover some top tips for men on how to dress correctly. The infographic is aimed at giving men the best chances of dressing appropriately.
Steps on How to Recover from Drugs and Alcohol Addiction
The journey to a healthy, sober life is not an easy one and needs a lifelong commitment and hard work. The specific steps of addiction recovery process will vary according to the addiction, the treatment plan used, and the individual. Learn more about these steps in the following infographic.
Top 16 NBA Careers Destroyed by Drugs
With the late drug charges towards the previous NBA player Lamar Odom, we again remember how risky these drugs are, especially in sports. To give you clear look, here is an infographic about these well-known NBA stars who destroyed their professions by letting drugs control their lives.
Fears & Phobias: A Clown’s Tale
If you are like 8.7% of adults, then you have a pet nemesis: a phobia. Phobias can be terribly banal, commonplace, and trivial, like the fear of blood, or some hairy, toothy animal. Most people see these things and shrug them off. But if that thing is your phobia, then for you, it’s like the freaking mother of all nasty, slimy, evil ugliness.
2015 Virtual Reality Consumer Report
The VR Consumer Report includes analysis from over 2,282 respondents including kids, millennials, and parents, regarding their preferences for virtual reality products and services. Touchstone Research has compiled some of the key insights from the report into a fun infographic.
Avoid Catfishing Online
No, we’re not talking about fishing in a river. Catfishing is the act of pretending to be someone else to fool someone online. Learn more about protecting yourself from catfishing in this infographic by FreeDating.co.uk.
Baby Boomers Guide To A Five Star Retirement
To fully understand the power and influence of the Baby Boomers, the team at Bluebird Care have produced a fascinating infographic on Baby Boomers in numbers. With tips & advice on how to live a healthy and active lifestyle, both mentally and physically, the infographic shows how easy it is to enjoy the life of a baby boomer as they progress into their golden years.
7 Steps to the Perfect Nap
Napping is an incredible way to boost our health and productivity. Among its many benefits, science has shown that it can enhance our mood, performance, memory and creativity. However, not all naps are created equal. To help you get the most out of your nap (and avoid that unpleasant groggy feeling), Art of Wellbeing has created this 7 step infographic.
How To Find Out What Type of Relationships You Are In?
Everyone wants to know about the seriousness of own relationships. The following infographic will help you to learn more about your partner. To read full article, click on the infographic itself.
Search 12,100+ Infographics!
Partners


Browse Archives By Category
Animated Infographics
Business Infographics
Career & Jobs Infographics
Education Infographics
Entertainment Industry Infographics
Environmental Infographics
Finance & Money Infographics
Food & Drink Infographics
Health Infographics
Historical Infographics
Home & Garden Infographics
Internet Infographics
Law and Legal Infographics
Lifestyle Infographics
Marketing Infographics
Offbeat Infographics
Parenting Infographics
Pets & Animals Infographics
Political Infographics
Shopping Infographics
Sports and Athletic Infographics
Technology Infographics
Transportation Infographics
Travel Infographics
Video Infographics