Marketing Infographics
The #1 Small Business Marketing Idea
Are you looking for small business marketing ideas that are cheap and effective? If so, what about the lowly blog? The blog is actually not lowly at all, but is by far the best marketing tool out there when you know how to use it effectively. Learn more about the benefits of blogging in this infographic
Why Infographics Are So Popular?
Infographics are simply the visual graphic representation of data or information. Mostly, anything can be converted into an infographic. They have been in use for many years. The first recorded infographic, was in fact, sketched out in the year 1626 by a man named Christoph Scheiner, who used infographics to demonstrate the Sun’s rotation patterns. Learn more about why these types of content are so popular in the following infographic.
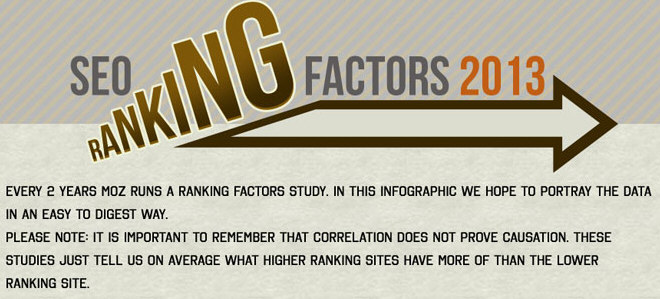
SEO Search Ranking Factors 2013
Earlier this month, Moz updated their annual survey of local search ranking factors, the survey includes: general ranking factors, specific ranking factors and negative ranking factors. The following infographic which illustrate the results.
27 Marketing Strategies To Double Traffic in Under 30 Days
Here are 27 proven marketing strategies that you can start implementing today to get more traffic. All of these methods work and have been tested with real results. Explore all the details in this infographic.
The Secret Art of Digital Marketing
Properly marketing something in the digital realm can seem elusive and mysterious. There’s multiple avenues that must be simultaneously tracked and measured in order to ensure you are doing an optimal job, and getting the most bang for your buck. The following infographic reveals The Secret Art of Digital Marketing.
Location-Based Marketing
Now, more than ever, consumers are relying on smart phones, mobile search and location-based apps to guide their in-store purchases. This infographic looks at the current state of location-based marketing.
A Brief History of Social Advertising
There have been many exciting moments in the social advertising market, so Unified Social has created a timeline infographic that shows major market players, including their API partners at Facebook, Twitter, Linkedln, StumbleUpon, and others that have emerged as social network leaders. They have created powerful new ways for advertising to reach the right consumers with the right message at the right time.
How Online Video Drives Brand Awareness
Video is a fantastic opportunity to produce content that informs, engages, and converts. Nearly 40% of companies are using video as part of their content strategy. In this infographic, see how video can help increase your brand awareness.
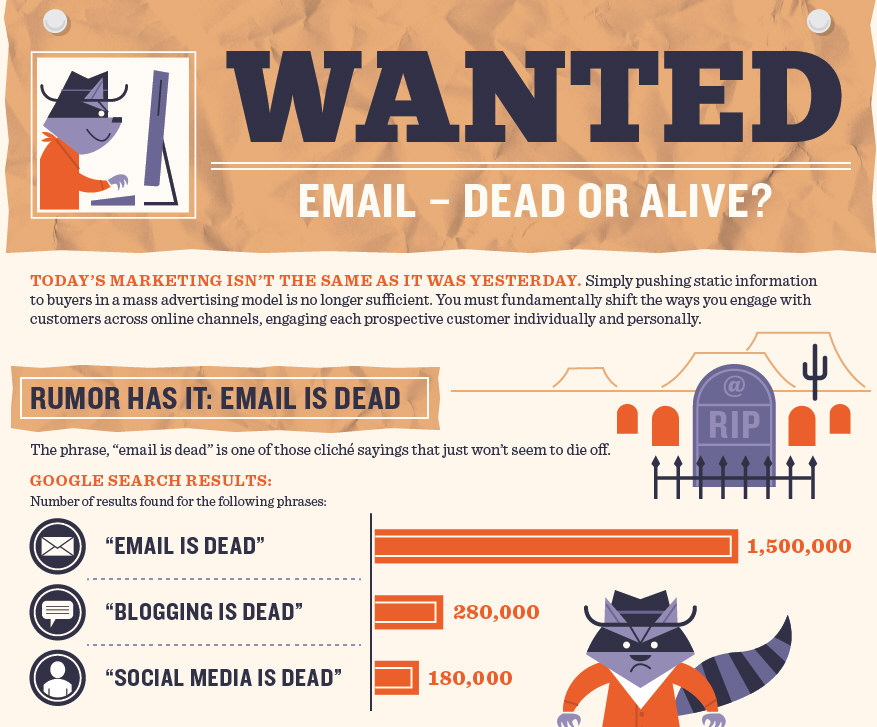
Email Wanted Dead or Alive
Rumor has it, email is dead. It seems that each time a new technology is introduced, people claim it will kill our reliance on email. Sure companies have access to social media, direct mail, and TV opportunities for communicating their message, yet email marketing is still the quickest and most direct way to reach the customer.
Does Your Facebook Page Need an Operation?
Socially Stacked thought using an “Operation” mentality — removing what doesn’t work and fixing what’s broken — would be a helpful way to give your Facebook Page a checkup. So what should you keep and what should you cut? Use this infographic to inspect the health of your business’s Page. For the areas you discover are weak, use the tips provided to get your Page into tip-top shape.
The #1 Small Business Marketing Idea
Are you looking for small business marketing ideas that are cheap and effective? If so, what about the lowly blog? The blog is actually not lowly at all, but is by far the best marketing tool out there when you know how to use it effectively. Learn more about the benefits of blogging in this infographic
Why Infographics Are So Popular?
Infographics are simply the visual graphic representation of data or information. Mostly, anything can be converted into an infographic. They have been in use for many years. The first recorded infographic, was in fact, sketched out in the year 1626 by a man named Christoph Scheiner, who used infographics to demonstrate the Sun’s rotation patterns. Learn more about why these types of content are so popular in the following infographic.
SEO Search Ranking Factors 2013
Earlier this month, Moz updated their annual survey of local search ranking factors, the survey includes: general ranking factors, specific ranking factors and negative ranking factors. The following infographic which illustrate the results.
27 Marketing Strategies To Double Traffic in Under 30 Days
Here are 27 proven marketing strategies that you can start implementing today to get more traffic. All of these methods work and have been tested with real results. Explore all the details in this infographic.
The Secret Art of Digital Marketing
Properly marketing something in the digital realm can seem elusive and mysterious. There’s multiple avenues that must be simultaneously tracked and measured in order to ensure you are doing an optimal job, and getting the most bang for your buck. The following infographic reveals The Secret Art of Digital Marketing.
Location-Based Marketing
Now, more than ever, consumers are relying on smart phones, mobile search and location-based apps to guide their in-store purchases. This infographic looks at the current state of location-based marketing.
A Brief History of Social Advertising
There have been many exciting moments in the social advertising market, so Unified Social has created a timeline infographic that shows major market players, including their API partners at Facebook, Twitter, Linkedln, StumbleUpon, and others that have emerged as social network leaders. They have created powerful new ways for advertising to reach the right consumers with the right message at the right time.
How Online Video Drives Brand Awareness
Video is a fantastic opportunity to produce content that informs, engages, and converts. Nearly 40% of companies are using video as part of their content strategy. In this infographic, see how video can help increase your brand awareness.
Email Wanted Dead or Alive
Rumor has it, email is dead. It seems that each time a new technology is introduced, people claim it will kill our reliance on email. Sure companies have access to social media, direct mail, and TV opportunities for communicating their message, yet email marketing is still the quickest and most direct way to reach the customer.
Does Your Facebook Page Need an Operation?
Socially Stacked thought using an “Operation” mentality — removing what doesn’t work and fixing what’s broken — would be a helpful way to give your Facebook Page a checkup. So what should you keep and what should you cut? Use this infographic to inspect the health of your business’s Page. For the areas you discover are weak, use the tips provided to get your Page into tip-top shape.
Search 12,100+ Infographics!
Partners


Browse Archives By Category
Animated Infographics
Business Infographics
Career & Jobs Infographics
Education Infographics
Entertainment Industry Infographics
Environmental Infographics
Finance & Money Infographics
Food & Drink Infographics
Health Infographics
Historical Infographics
Home & Garden Infographics
Internet Infographics
Law and Legal Infographics
Lifestyle Infographics
Marketing Infographics
Offbeat Infographics
Parenting Infographics
Pets & Animals Infographics
Political Infographics
Shopping Infographics
Sports and Athletic Infographics
Technology Infographics
Transportation Infographics
Travel Infographics
Video Infographics