Political Infographics
A History of Presidential Inaugurations
On January 20th, 2013, President Obama will be sworn in for his second term as the 44th President of the United States. Because January 20th falls on a Sunday this year, the ceremony for the public will take place on Monday, January 21st. In honor of this historic event, WyzAnt.com, a national marketplace of in home tutors, has created a visual overview of presidential inaugurations over the last 80 years including a summary of the state of the nation at the time each president was sworn into office.
Shedding Light on America’s Homeless Veterans
One of the major challenges facing veterans is homelessness. Of the 636,017 homeless people in the United States, 67,495 are veterans. Veterans are twice as likely to become chronically homeless as other Americans. This is due, in part, to veterans’ heightened risk of unemployment, foreclosure and poverty. Check out this Infographic USC’s Masters in Military Social Work Program from to learn more about this demographic of homeless Americans and how the government and nonprofit organizations are addressing the issue.
Women in Senate By the Numbers
1992 was deemed “The Year of the Woman” because there were 7 female Senators elected. Twenty years later, we have almost tripled that number. In fact, did you know that 20% of the 2013 Senate will be made up of women? NerdWallet explains why this election is historic and who these women are.
Mobile is Transforming Political Engagement
payvia, the company powering political contributions for Obama and Romney’s campaigns, attempts to break down the effect that mobile technology had on this year’s election, while looking to the future on what to expect for the 2016 election.
Do You Have What It Takes To Be In The Secret Service?
With the Presidential race over I thought this would be interesting to share. Do you have what it takes to watch over the President of the United States? This is a great flow-chart that can help you answer just that.
Which Sector Elects the Next U.S. President?
Now that we know who has won the 2012 presidential Election, this infographic from innumberswetrust.tumblr.com provides a look at sector-based individual contributions over $200 in the 2012 United States presidential election.
Are The Feds Preparing For Civil War?
Is the government preparing to put down widespread civil strife or uprising? After four years of economic woe, and an all-time low approval rating for congress, many Americans are asking this question. With a government that’s seemingly out of control, conspiracy theories are popping up about what’s “really” going on – and there’s more truth to these theories than you might think. Get the facts in the following infographic before it’s too late and see what you should be concerned about.
The Business of Running for President
Much like running a corporation, running for president is an expensive and time-consuming undertaking. Just like a corporation, a campaign involves employees, money management, public relations, advertising and the selling of a product or service, which in this case is the person running for office. This infographic takes a look at just what all it takes to run for president, and how big of a business doing so has become.
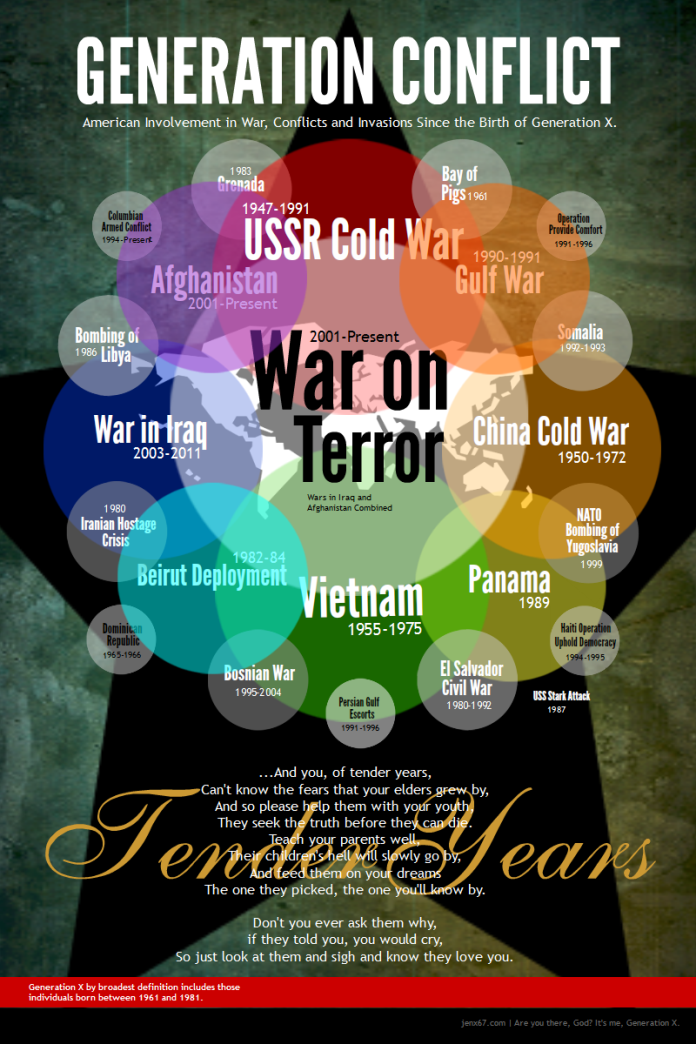
Generation Conflict: War, Conflicts & Invasions Since Gen X
America has been involved in 22 official wars, conflicts and invasions since the beginning of Generation X, which by broadest definition starts in 1961 and ends at 1981. Although the losses can’t compare to the Baby Boomer’s Vietnam or the Silent Generation’s World War II or Korea, Americans are war weary and that includes Generations X and Y as you will see in the following infographic.
Obama vs. Romney Intellectual Property Policy
The Intellectual Property industry is a rapidly growing industry in the US with 74% of all US exports being related to this industry. More than likely, you will not hear this particular topic being brought up in major debates. It is not a focus on the campaign trail, but it is an important focal point for the US job market. Take a look at these statistics on IP as it relates to your candidate of choice.
A History of Presidential Inaugurations
On January 20th, 2013, President Obama will be sworn in for his second term as the 44th President of the United States. Because January 20th falls on a Sunday this year, the ceremony for the public will take place on Monday, January 21st. In honor of this historic event, WyzAnt.com, a national marketplace of in home tutors, has created a visual overview of presidential inaugurations over the last 80 years including a summary of the state of the nation at the time each president was sworn into office.
Shedding Light on America’s Homeless Veterans
One of the major challenges facing veterans is homelessness. Of the 636,017 homeless people in the United States, 67,495 are veterans. Veterans are twice as likely to become chronically homeless as other Americans. This is due, in part, to veterans’ heightened risk of unemployment, foreclosure and poverty. Check out this Infographic USC’s Masters in Military Social Work Program from to learn more about this demographic of homeless Americans and how the government and nonprofit organizations are addressing the issue.
Women in Senate By the Numbers
1992 was deemed “The Year of the Woman” because there were 7 female Senators elected. Twenty years later, we have almost tripled that number. In fact, did you know that 20% of the 2013 Senate will be made up of women? NerdWallet explains why this election is historic and who these women are.
Mobile is Transforming Political Engagement
payvia, the company powering political contributions for Obama and Romney’s campaigns, attempts to break down the effect that mobile technology had on this year’s election, while looking to the future on what to expect for the 2016 election.
Do You Have What It Takes To Be In The Secret Service?
With the Presidential race over I thought this would be interesting to share. Do you have what it takes to watch over the President of the United States? This is a great flow-chart that can help you answer just that.
Which Sector Elects the Next U.S. President?
Now that we know who has won the 2012 presidential Election, this infographic from innumberswetrust.tumblr.com provides a look at sector-based individual contributions over $200 in the 2012 United States presidential election.
Are The Feds Preparing For Civil War?
Is the government preparing to put down widespread civil strife or uprising? After four years of economic woe, and an all-time low approval rating for congress, many Americans are asking this question. With a government that’s seemingly out of control, conspiracy theories are popping up about what’s “really” going on – and there’s more truth to these theories than you might think. Get the facts in the following infographic before it’s too late and see what you should be concerned about.
The Business of Running for President
Much like running a corporation, running for president is an expensive and time-consuming undertaking. Just like a corporation, a campaign involves employees, money management, public relations, advertising and the selling of a product or service, which in this case is the person running for office. This infographic takes a look at just what all it takes to run for president, and how big of a business doing so has become.
Generation Conflict: War, Conflicts & Invasions Since Gen X
America has been involved in 22 official wars, conflicts and invasions since the beginning of Generation X, which by broadest definition starts in 1961 and ends at 1981. Although the losses can’t compare to the Baby Boomer’s Vietnam or the Silent Generation’s World War II or Korea, Americans are war weary and that includes Generations X and Y as you will see in the following infographic.
Obama vs. Romney Intellectual Property Policy
The Intellectual Property industry is a rapidly growing industry in the US with 74% of all US exports being related to this industry. More than likely, you will not hear this particular topic being brought up in major debates. It is not a focus on the campaign trail, but it is an important focal point for the US job market. Take a look at these statistics on IP as it relates to your candidate of choice.
Search 12,000+ Infographics!
Partners


Browse Archives By Category
Animated Infographics
Business Infographics
Career & Jobs Infographics
Education Infographics
Entertainment Industry Infographics
Environmental Infographics
Finance & Money Infographics
Food & Drink Infographics
Health Infographics
Historical Infographics
Home & Garden Infographics
Internet Infographics
Law and Legal Infographics
Lifestyle Infographics
Marketing Infographics
Offbeat Infographics
Parenting Infographics
Pets & Animals Infographics
Political Infographics
Shopping Infographics
Sports and Athletic Infographics
Technology Infographics
Transportation Infographics
Travel Infographics
Video Infographics