Transportation Infographics
The Most Popular Used and New Vehicles by State
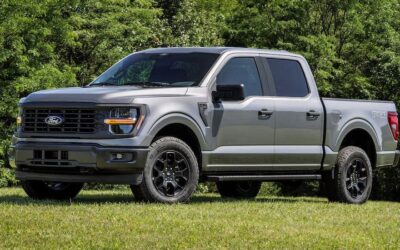
What people say they want in a car and what they actually shop for aren’t always the same. This infographic describes the most popular new and used vehicles in all 50 states, based on CarGurus lead submission data. The study highlights that regional needs and price sensitivity shape the market, with full-size pickup trucks, particularly the used Ford F-150, dominating a majority of states.

The Most Expensive U.S. States to Own a Car
Car purchase and maintenance costs are rising, leaving many Americans wondering how to make ownership more affordable. The team at Grease Monkey shows us that location is a significant factor in car ownership expenses. The team examined 15 car-related expenses and mapped each state based on these costs.

Where in the U.S. Do Cars Experience the Most Damage?
Many factors can damage a car, leading to expensive repairs or even a total loss. The Grease Monkey researcher considered the most impactful factors that damage a car and used this to score every state. Their results show that cars in Texas see the most damage.

Boat Types Explained: From Kayaks to Super Yachts
The modern boating landscape extends far beyond the traditional “sail or power” divide. Today’s market spans everything from simple paddle-powered vessels to expansive, ocean-crossing yachts equipped with satellite internet, hybrid propulsion systems, and luxury accommodations. With such a wide range of options available, understanding the distinctions between boat types is essential to determining which is best suited to your needs.

Where In the U.S. Is It the Most Dangerous To Drive During New Year’s?
If you need to drive on New Year’s Eve or Day, be aware that this can be one of the most dangerous times of year to drive. Knowing where and when driving is the most dangerous could help save lives. According to a recent study from CarInsurance.com, the highest risk states for New Year’s driving are Mississippi, South Carolina, and Louisiana.

Every Movie With an El Camino Appearance
Here is an infographic from Speedway Motors shows that Chevrolet’s El Camino has had an incredible number of on-screen appearances. This sleek muscle car is a favorite among directors and cinematographers, as shown in this massive list of film appearances.

7 Ways Aging Affects Driving
According to the National Safety Council (NSC), 4,829 drivers aged 65 and older were killed in traffic crashes in 2023. But while overall crash rates for senior drivers are actually lower than for other groups, older drivers have higher rates of crashes per mile driven. This suggests that they drive less, but are still at higher risk than other groups.

Drunk Driving Statistics 2025
Drunk driving claims approximately 34 lives every day across the U.S. These deaths are preventable, but they continue to occur due to impaired judgment and the assumption that driving after just one drink is safe. This infographic dives into drunk driving in the United States, including its prevalence, its impact, and its consequences.

Every Color You Can Buy a Camaro in Every Year Since 1967
The following graphic from Speedway Motors is an excellent visualization of automotive data and history. It showcases the Camaro and every shade of color it was available in each year. That’s decades of history represented since 1967.
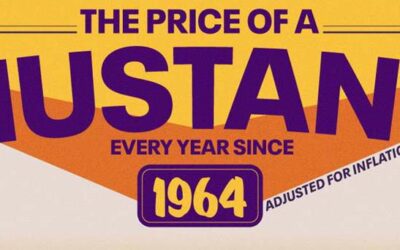
The Price of a Mustang Every Year Since 1964
The team at Speedway Motors shines the spotlight on a beloved American classic muscle car: the Ford Mustang. The Mustang debuted in the 1960s and remains popular today. Through the team’s graphics, we can not only see the changes in style and tech with each new release of the car, but we can also see how the price has changed.
The Most Popular Used and New Vehicles by State
What people say they want in a car and what they actually shop for aren’t always the same. This infographic describes the most popular new and used vehicles in all 50 states, based on CarGurus lead submission data. The study highlights that regional needs and price sensitivity shape the market, with full-size pickup trucks, particularly the used Ford F-150, dominating a majority of states.
The Most Expensive U.S. States to Own a Car
Car purchase and maintenance costs are rising, leaving many Americans wondering how to make ownership more affordable. The team at Grease Monkey shows us that location is a significant factor in car ownership expenses. The team examined 15 car-related expenses and mapped each state based on these costs.
Where in the U.S. Do Cars Experience the Most Damage?
Many factors can damage a car, leading to expensive repairs or even a total loss. The Grease Monkey researcher considered the most impactful factors that damage a car and used this to score every state. Their results show that cars in Texas see the most damage.
Boat Types Explained: From Kayaks to Super Yachts
The modern boating landscape extends far beyond the traditional “sail or power” divide. Today’s market spans everything from simple paddle-powered vessels to expansive, ocean-crossing yachts equipped with satellite internet, hybrid propulsion systems, and luxury accommodations. With such a wide range of options available, understanding the distinctions between boat types is essential to determining which is best suited to your needs.
Where In the U.S. Is It the Most Dangerous To Drive During New Year’s?
If you need to drive on New Year’s Eve or Day, be aware that this can be one of the most dangerous times of year to drive. Knowing where and when driving is the most dangerous could help save lives. According to a recent study from CarInsurance.com, the highest risk states for New Year’s driving are Mississippi, South Carolina, and Louisiana.
Every Movie With an El Camino Appearance
Here is an infographic from Speedway Motors shows that Chevrolet’s El Camino has had an incredible number of on-screen appearances. This sleek muscle car is a favorite among directors and cinematographers, as shown in this massive list of film appearances.
7 Ways Aging Affects Driving
According to the National Safety Council (NSC), 4,829 drivers aged 65 and older were killed in traffic crashes in 2023. But while overall crash rates for senior drivers are actually lower than for other groups, older drivers have higher rates of crashes per mile driven. This suggests that they drive less, but are still at higher risk than other groups.
Drunk Driving Statistics 2025
Drunk driving claims approximately 34 lives every day across the U.S. These deaths are preventable, but they continue to occur due to impaired judgment and the assumption that driving after just one drink is safe. This infographic dives into drunk driving in the United States, including its prevalence, its impact, and its consequences.
Every Color You Can Buy a Camaro in Every Year Since 1967
The following graphic from Speedway Motors is an excellent visualization of automotive data and history. It showcases the Camaro and every shade of color it was available in each year. That’s decades of history represented since 1967.
The Price of a Mustang Every Year Since 1964
The team at Speedway Motors shines the spotlight on a beloved American classic muscle car: the Ford Mustang. The Mustang debuted in the 1960s and remains popular today. Through the team’s graphics, we can not only see the changes in style and tech with each new release of the car, but we can also see how the price has changed.
Search 12,100+ Infographics!
Partners


Browse Archives By Category
Animated Infographics
Business Infographics
Career & Jobs Infographics
Education Infographics
Entertainment Industry Infographics
Environmental Infographics
Finance & Money Infographics
Food & Drink Infographics
Health Infographics
Historical Infographics
Home & Garden Infographics
Internet Infographics
Law and Legal Infographics
Lifestyle Infographics
Marketing Infographics
Offbeat Infographics
Parenting Infographics
Pets & Animals Infographics
Political Infographics
Shopping Infographics
Sports and Athletic Infographics
Technology Infographics
Transportation Infographics
Travel Infographics
Video Infographics