Transportation Infographics
The Australian Commuting Survey
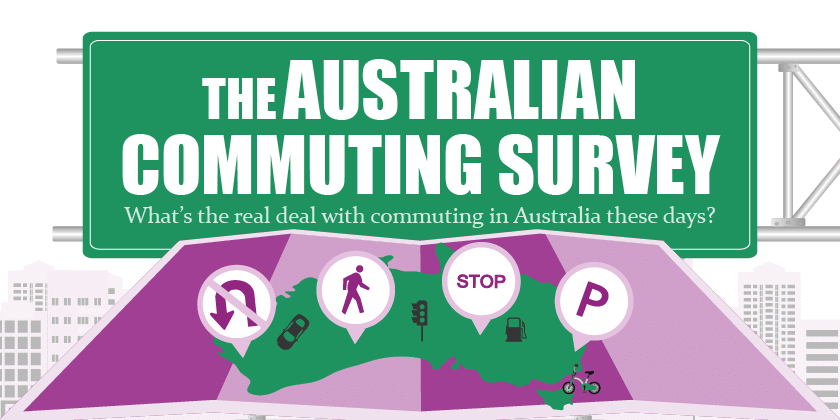
There will always be those who bounce out of bed each morning, eagerly awaiting the challenges and rewards that the new working day holds. But for many, the demands of their jobs are made all the more tiring and difficult thanks to a stressful work commute. The added pressure of the work commute, among several other findings, is at the center of the Australian Commuting Survey.
20 Key Facts You Should Know Before Driving
This infographic features the leading causes of fatal road crashes in the UK, including breaking the speed limit, drunk driving, not paying attention, careless or aggressive driving, and not wearing a seat belt. Many of these and the majority of reasons for road traffic accidents can be avoided with a bit more care and self-awareness when on the road.
Everything You Need to Know About Flat Tires
One of the biggest headaches of being a car owner is having to deal with a flat tire. Inevitably it will happen to you at one time or another, and it can be a stressful situation if you don’t know what to do. Here is an infographic that provides more information on how to change a flat tire and help you be prepared when the inevitable happens.

16 Car Cleaning Hacks
Most car owners understand that keeping a car clean during a busy week is not always easy. So the team at OSV have come up with 16 expert hacks to help keep things in pristine condition with little or no effort and have compiled them into the following infographic....
The 15 Corporations That Create Most Cars
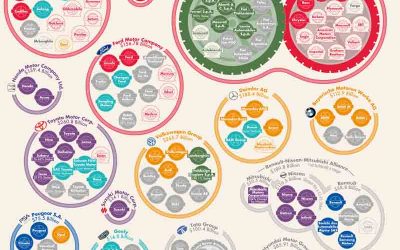
With such a wide variety of car brands and car models, it may come as a surprise that only 15 corporations are behind the creation of most cars that are on the road. This infographic has a lot of information to cruise through regarding these 15 parent companies including the current and retired car brands under each, as well as the country that each corporation is located in.

10 Types of Rideshare Drivers and How to Handle Them
With every ride-share journey, you enter a roulette, one where you are being paired with your very own human chauffeur. This means that you’ll to be forced to interact with a stranger that could become your best friend or your worst enemy. Here is a guide created by The Zebra to the most common ride-share driver personalities and how to handle them.
Truck Accidents: Big Dangers Lurking on the Road
The American economy is reliant on the ability of commercial trucks to deliver goods back and forth between our communities. From food to medical supplies to consumer goods and beyond, many of our daily items are shipped by trucks. Because of this, America has an incredibly high quantity of semi-trucks on the road and for the innocent motorist who shares the road, trucks are a deadly menace.
Drowsy Driving: Spotting the Signs of a Tired Truck Driver
18 wheelers and other large vehicles are responsible for a lot of the traffic fatalities each year. One reason for this is drowsy driving. Truck drivers often work long days, which can cause drowsiness at the wheel. This can lead to crashes. You can protect yourself and your passengers by understanding the signs of drowsy driving.
How to Make a Parking Lot ADA Compliant
The team at Wright Construction Company has created the following infographic detailing all of the requirements businesses must follow in order to make their parking lot handicap accessible.

Top 5 Selling Fords of All Time
Ford is one of the most iconic and storied car brands on the road today and has been for the past 100 hundred years. Because of this exceptional legacy, the team at Thorncrest Ford has created an infographic that celebrates Henry Ford’s remarkable achievement that has lived to this day. They chose the top 5 selling Fords of all time as homage.
The Australian Commuting Survey
There will always be those who bounce out of bed each morning, eagerly awaiting the challenges and rewards that the new working day holds. But for many, the demands of their jobs are made all the more tiring and difficult thanks to a stressful work commute. The added pressure of the work commute, among several other findings, is at the center of the Australian Commuting Survey.
20 Key Facts You Should Know Before Driving
This infographic features the leading causes of fatal road crashes in the UK, including breaking the speed limit, drunk driving, not paying attention, careless or aggressive driving, and not wearing a seat belt. Many of these and the majority of reasons for road traffic accidents can be avoided with a bit more care and self-awareness when on the road.
Everything You Need to Know About Flat Tires
One of the biggest headaches of being a car owner is having to deal with a flat tire. Inevitably it will happen to you at one time or another, and it can be a stressful situation if you don’t know what to do. Here is an infographic that provides more information on how to change a flat tire and help you be prepared when the inevitable happens.
16 Car Cleaning Hacks
Most car owners understand that keeping a car clean during a busy week is not always easy. So the team at OSV have come up with 16 expert hacks to help keep things in pristine condition with little or no effort and have compiled them into the following infographic....
The 15 Corporations That Create Most Cars
With such a wide variety of car brands and car models, it may come as a surprise that only 15 corporations are behind the creation of most cars that are on the road. This infographic has a lot of information to cruise through regarding these 15 parent companies including the current and retired car brands under each, as well as the country that each corporation is located in.
10 Types of Rideshare Drivers and How to Handle Them
With every ride-share journey, you enter a roulette, one where you are being paired with your very own human chauffeur. This means that you’ll to be forced to interact with a stranger that could become your best friend or your worst enemy. Here is a guide created by The Zebra to the most common ride-share driver personalities and how to handle them.
Truck Accidents: Big Dangers Lurking on the Road
The American economy is reliant on the ability of commercial trucks to deliver goods back and forth between our communities. From food to medical supplies to consumer goods and beyond, many of our daily items are shipped by trucks. Because of this, America has an incredibly high quantity of semi-trucks on the road and for the innocent motorist who shares the road, trucks are a deadly menace.
Drowsy Driving: Spotting the Signs of a Tired Truck Driver
18 wheelers and other large vehicles are responsible for a lot of the traffic fatalities each year. One reason for this is drowsy driving. Truck drivers often work long days, which can cause drowsiness at the wheel. This can lead to crashes. You can protect yourself and your passengers by understanding the signs of drowsy driving.
How to Make a Parking Lot ADA Compliant
The team at Wright Construction Company has created the following infographic detailing all of the requirements businesses must follow in order to make their parking lot handicap accessible.
Top 5 Selling Fords of All Time
Ford is one of the most iconic and storied car brands on the road today and has been for the past 100 hundred years. Because of this exceptional legacy, the team at Thorncrest Ford has created an infographic that celebrates Henry Ford’s remarkable achievement that has lived to this day. They chose the top 5 selling Fords of all time as homage.
Search 12,100+ Infographics!
Partners


Browse Archives By Category
Animated Infographics
Business Infographics
Career & Jobs Infographics
Education Infographics
Entertainment Industry Infographics
Environmental Infographics
Finance & Money Infographics
Food & Drink Infographics
Health Infographics
Historical Infographics
Home & Garden Infographics
Internet Infographics
Law and Legal Infographics
Lifestyle Infographics
Marketing Infographics
Offbeat Infographics
Parenting Infographics
Pets & Animals Infographics
Political Infographics
Shopping Infographics
Sports and Athletic Infographics
Technology Infographics
Transportation Infographics
Travel Infographics
Video Infographics