Transportation Infographics
The History of Public Transportation
Since the 1820s, various forms of public transportation have come and gone throughout the world, making an impact not only on how we travel but also on today’s general structuring of cities. As the earliest bus services started springing up all over the world, getting from point A to point B became easier than ever, furthering the divide between urban city centers and suburban neighborhoods.
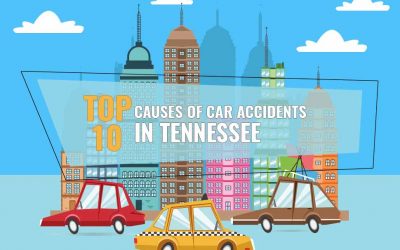
Top 10 Causes of Car Accidents in Tennessee in 2017
We can be the safest driver on the road but that does not assure that other drivers will behave the same manner. It is important to be aware of the main causes of car accidents and how to prevent them. The following infographic by Matt Hardin Law looks at the top 10 causes of accidents in Tennessee in 2017.
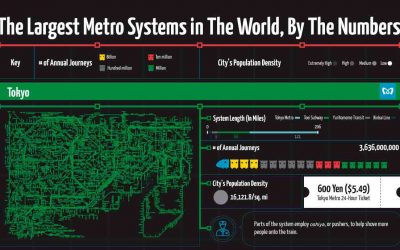
The Largest Metro Systems Worldwide
Have you ever wondered which city in the world has the best public transportation? This microscopic look into massive metro systems across the globe from TitleMax can help you find out. From system length to annual journeys to ticket prices to the size of the cities they serve, the information here can paint the wider picture of global public transport.
Car Safety Patents That Saved Millions Of Lives
When we hop in our cars, we take for granted the various safety features that help keep us safe when driving, but they haven’t always been there. In fact, at one time, cars were really quite unsafe and dangerous to drive. This infographic takes a look back at the original patents at some of those common safety features in our cars and how they first came about, including seat belts, windscreen wipers, airbags and more.
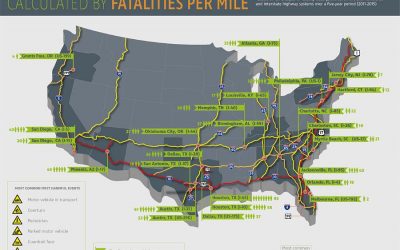
The 25 Most Dangerous Highways in the United States
Over 35 thousand people died in automobile accidents in 2015. While this number was slowing dropping as society made more and more safety advancements over the past several decades, the number unexpectedly increased in the last few years and shows no signs of dipping again. This begs the question, ‘Which highways are the most dangerous?”
Things That Go Bump – In the Car
Almost one in three motorists have had a parking prang in the last 12 months. Although it seems that men are far less likely to confess to one than women, research conducted by OSV, the UK’s leading independent vehicle supply professionals, has revealed that in the last 12 months a whopping 29% of motorists have had a minor prang while parking.
Truck Accidents in Texas
Because of their weight and size, big trucks can cause accidents that have devastating consequences for everyone involved. In this infographic, courtesy of Attorney Terry Bryant, learn all about some of the common causes of truck accidents and the statistics surrounding them.
New York City Driving Safety
Did you know that there are over 300,000 accidents in New York state each year involving 530,000 vehicles? Or how about the fact that 170,000 people are injured in collisions and almost 1,200 are killed? These and other New York City driving statistics can be found in the following infographic.
South Carolina Car Crash Statistics
On average, a traffic collision occurs every 4 minutes and a person is killed in a vehicle crash every 9 hours in South Carolina. Learn more sobering facts about car accidents by viewing the following infographic.

The Top 10 Largest Super Yachts
Super Yachts are the ultimate toys for billionaires all over the world. They are often extravagant and built to house many guests and crew, and include impressive structures such as glass staircases, dining halls and even spaces for live music. In this list of the top 10 largest super yachts, there’s even a submarine and a missile defense system.
The History of Public Transportation
Since the 1820s, various forms of public transportation have come and gone throughout the world, making an impact not only on how we travel but also on today’s general structuring of cities. As the earliest bus services started springing up all over the world, getting from point A to point B became easier than ever, furthering the divide between urban city centers and suburban neighborhoods.
Top 10 Causes of Car Accidents in Tennessee in 2017
We can be the safest driver on the road but that does not assure that other drivers will behave the same manner. It is important to be aware of the main causes of car accidents and how to prevent them. The following infographic by Matt Hardin Law looks at the top 10 causes of accidents in Tennessee in 2017.
The Largest Metro Systems Worldwide
Have you ever wondered which city in the world has the best public transportation? This microscopic look into massive metro systems across the globe from TitleMax can help you find out. From system length to annual journeys to ticket prices to the size of the cities they serve, the information here can paint the wider picture of global public transport.
Car Safety Patents That Saved Millions Of Lives
When we hop in our cars, we take for granted the various safety features that help keep us safe when driving, but they haven’t always been there. In fact, at one time, cars were really quite unsafe and dangerous to drive. This infographic takes a look back at the original patents at some of those common safety features in our cars and how they first came about, including seat belts, windscreen wipers, airbags and more.
The 25 Most Dangerous Highways in the United States
Over 35 thousand people died in automobile accidents in 2015. While this number was slowing dropping as society made more and more safety advancements over the past several decades, the number unexpectedly increased in the last few years and shows no signs of dipping again. This begs the question, ‘Which highways are the most dangerous?”
Things That Go Bump – In the Car
Almost one in three motorists have had a parking prang in the last 12 months. Although it seems that men are far less likely to confess to one than women, research conducted by OSV, the UK’s leading independent vehicle supply professionals, has revealed that in the last 12 months a whopping 29% of motorists have had a minor prang while parking.
Truck Accidents in Texas
Because of their weight and size, big trucks can cause accidents that have devastating consequences for everyone involved. In this infographic, courtesy of Attorney Terry Bryant, learn all about some of the common causes of truck accidents and the statistics surrounding them.
New York City Driving Safety
Did you know that there are over 300,000 accidents in New York state each year involving 530,000 vehicles? Or how about the fact that 170,000 people are injured in collisions and almost 1,200 are killed? These and other New York City driving statistics can be found in the following infographic.
South Carolina Car Crash Statistics
On average, a traffic collision occurs every 4 minutes and a person is killed in a vehicle crash every 9 hours in South Carolina. Learn more sobering facts about car accidents by viewing the following infographic.
The Top 10 Largest Super Yachts
Super Yachts are the ultimate toys for billionaires all over the world. They are often extravagant and built to house many guests and crew, and include impressive structures such as glass staircases, dining halls and even spaces for live music. In this list of the top 10 largest super yachts, there’s even a submarine and a missile defense system.
Search 12,100+ Infographics!
Partners


Browse Archives By Category
Animated Infographics
Business Infographics
Career & Jobs Infographics
Education Infographics
Entertainment Industry Infographics
Environmental Infographics
Finance & Money Infographics
Food & Drink Infographics
Health Infographics
Historical Infographics
Home & Garden Infographics
Internet Infographics
Law and Legal Infographics
Lifestyle Infographics
Marketing Infographics
Offbeat Infographics
Parenting Infographics
Pets & Animals Infographics
Political Infographics
Shopping Infographics
Sports and Athletic Infographics
Technology Infographics
Transportation Infographics
Travel Infographics
Video Infographics