Transportation Infographics
Tire Pressure Defined: From Passenger Cars to Construction Heavyweights
Whether you’re a car owner or work in the automobile industry, understanding the importance of tire pressure is vital for vehicle performance and safety. Maintaining the correct tire pressure ensures optimal fuel efficiency, improves handling, and extends tire lifespan.

The Most Dangerous States for Boating Deaths
Boating is a fun pastime that gets people outside and on the water for fresh air and exercise. Unfortunately, boating can come with a lot of risks. The team at SI Yachts maps out the most dangerous states in the country based on the number of boating deaths per boating registration.
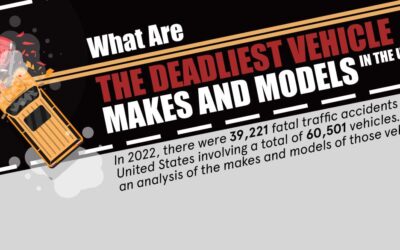
The Deadliest Vehicle Makes and Models in the U.S.
The team at Convoy Car Shipping shows us which vehicle makes and models are the deadliest with the following infographic. Learn how many of these cars were involved in fatal accidents overall, as well as how many of these models were involved in fatal accidents per 100,000 cars sold.

Which Auto Manufacturers Have Had The Most Safety Recalls?
In the years since 2010, Ford Motor Company has issued 545 safety recalls. Though Ford did not rank at the top every year for most recalls, they have ranked first consecutively since 2021. In the following infographic, Automotive Touch Up Paint looks at which auto manufacturers have had the most safety recalls.
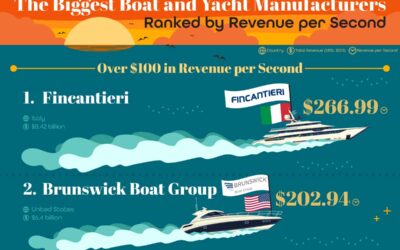
The Biggest Boat and Yacht Manufacturers Ranked by Revenue Per Second
Yachts are synonymous with luxury, evoking images of sun-soaked days, elite gatherings, and the lifestyle of the rich and famous. But have you ever wondered just how much yacht manufacturers rake in? SI Yachts has crafted an infographic that reveals the brands generating the highest revenue per second.
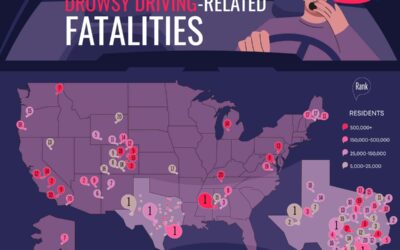
The Deadliest U.S. Counties for Drowsy Driving-Related Fatalities
Every year, drowsy driving is one of the leading causes of driving-related deaths. Many people are on long drives and get drowsy while others get behind the wheel in a less than alert state and despite good intentions, they cause an accident. The team at Naplab has created the following visual which displays the counties with the highest percentage of drowsy driving fatalities relative to the population.
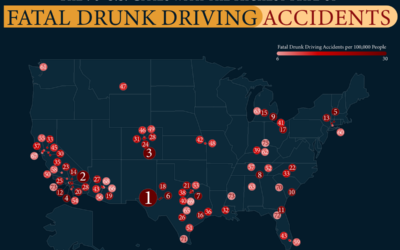
75 U.S. Cities with the Highest Rate of Fatal Drunk Driving Accidents
Every year at holidays and festivals, we’re reminded that drunk driving can have fatal consequences. The team at MTVLaw decided to paint a dire picture of how serious this problem is with a map of which cities have the most drunk driving fatalities. Odessa, Texas is on the top of the list. Between 2018 and 2022, this city recorded 31 fatal drunk driving accidents.
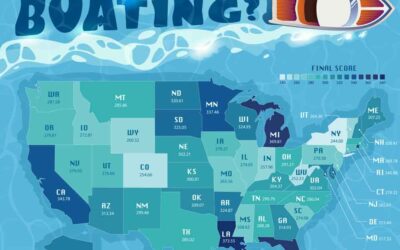
What Is The Best State In the U.S. For Boating?
The team at SIYachts.com have created the following infographic for boaters and travelers which ranks every U.S. State by how boater-friendly it is. They used a long list of criteria to determine this ranking, including data on weather, coastline, number of marinas, number of licensed boats in the state, etc. The results offer a nice variety, representing states in regions all over the country.
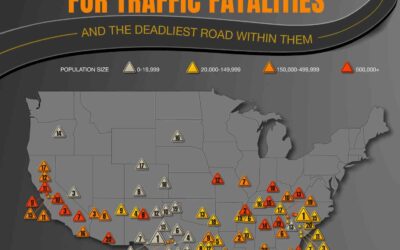
Which U.S. County Has the Highest Traffic Fatalities?
Car accidents ending in death are all too common in the United States. That’s why this so infographic is important work that gives illumination data about which locations have the most dangerous roads. The results are divided by population density per location, which can have a large impact on the frequency of deadly accidents.

Arkansas Car Crash Statistics
While there are many reasons people might get in a car accident, the following infographic below states some of the data behind why it happens and what to do in the aftermath. One of the most important steps is finding an experienced car accident lawyer to ease the burden off of your shoulders.
Tire Pressure Defined: From Passenger Cars to Construction Heavyweights
Whether you’re a car owner or work in the automobile industry, understanding the importance of tire pressure is vital for vehicle performance and safety. Maintaining the correct tire pressure ensures optimal fuel efficiency, improves handling, and extends tire lifespan.
The Most Dangerous States for Boating Deaths
Boating is a fun pastime that gets people outside and on the water for fresh air and exercise. Unfortunately, boating can come with a lot of risks. The team at SI Yachts maps out the most dangerous states in the country based on the number of boating deaths per boating registration.
The Deadliest Vehicle Makes and Models in the U.S.
The team at Convoy Car Shipping shows us which vehicle makes and models are the deadliest with the following infographic. Learn how many of these cars were involved in fatal accidents overall, as well as how many of these models were involved in fatal accidents per 100,000 cars sold.
Which Auto Manufacturers Have Had The Most Safety Recalls?
In the years since 2010, Ford Motor Company has issued 545 safety recalls. Though Ford did not rank at the top every year for most recalls, they have ranked first consecutively since 2021. In the following infographic, Automotive Touch Up Paint looks at which auto manufacturers have had the most safety recalls.
The Biggest Boat and Yacht Manufacturers Ranked by Revenue Per Second
Yachts are synonymous with luxury, evoking images of sun-soaked days, elite gatherings, and the lifestyle of the rich and famous. But have you ever wondered just how much yacht manufacturers rake in? SI Yachts has crafted an infographic that reveals the brands generating the highest revenue per second.
The Deadliest U.S. Counties for Drowsy Driving-Related Fatalities
Every year, drowsy driving is one of the leading causes of driving-related deaths. Many people are on long drives and get drowsy while others get behind the wheel in a less than alert state and despite good intentions, they cause an accident. The team at Naplab has created the following visual which displays the counties with the highest percentage of drowsy driving fatalities relative to the population.
75 U.S. Cities with the Highest Rate of Fatal Drunk Driving Accidents
Every year at holidays and festivals, we’re reminded that drunk driving can have fatal consequences. The team at MTVLaw decided to paint a dire picture of how serious this problem is with a map of which cities have the most drunk driving fatalities. Odessa, Texas is on the top of the list. Between 2018 and 2022, this city recorded 31 fatal drunk driving accidents.
What Is The Best State In the U.S. For Boating?
The team at SIYachts.com have created the following infographic for boaters and travelers which ranks every U.S. State by how boater-friendly it is. They used a long list of criteria to determine this ranking, including data on weather, coastline, number of marinas, number of licensed boats in the state, etc. The results offer a nice variety, representing states in regions all over the country.
Which U.S. County Has the Highest Traffic Fatalities?
Car accidents ending in death are all too common in the United States. That’s why this so infographic is important work that gives illumination data about which locations have the most dangerous roads. The results are divided by population density per location, which can have a large impact on the frequency of deadly accidents.
Arkansas Car Crash Statistics
While there are many reasons people might get in a car accident, the following infographic below states some of the data behind why it happens and what to do in the aftermath. One of the most important steps is finding an experienced car accident lawyer to ease the burden off of your shoulders.
Search 12,100+ Infographics!
Partners


Browse Archives By Category
Animated Infographics
Business Infographics
Career & Jobs Infographics
Education Infographics
Entertainment Industry Infographics
Environmental Infographics
Finance & Money Infographics
Food & Drink Infographics
Health Infographics
Historical Infographics
Home & Garden Infographics
Internet Infographics
Law and Legal Infographics
Lifestyle Infographics
Marketing Infographics
Offbeat Infographics
Parenting Infographics
Pets & Animals Infographics
Political Infographics
Shopping Infographics
Sports and Athletic Infographics
Technology Infographics
Transportation Infographics
Travel Infographics
Video Infographics