Transportation Infographics
10 Deadliest Counties for Illinois Drivers
This infographic provides important data about the most dangerous counties in Illinois for drivers. This data was compiled using information from the Illinois Dept. of Transportation and U.S. Census Bureau Illinois Quick Facts.
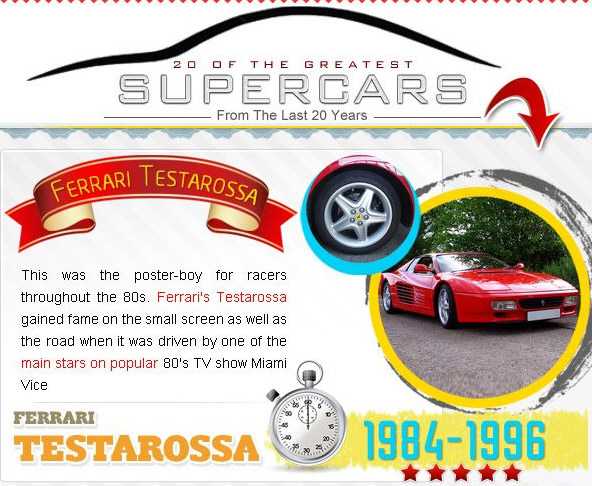
20 Of The Greatest Supercars From The Last 20 Years
The motor industry has come in leaps and bounds over the last twenty years. New technologies have allowed for bigger, better and faster supercars. We’ve seen ferocious Ferraris and beautiful Bugatti’s, but which was the best? In order to help you decide, Romans International has assembled the 20 greatest supercars from the last 20 years. Which is your favorite?
Free Parking Fallacies
Free parking isn’t exactly “free.” There is a high cost and we all pay for it in one way or another. The market value of America’s parking is over $310 billion and very little of that is ever collected directly. MyParkingSign has collected data from leading parking experts and it’s own sales to put together an infographic better explaining how the issues in America’s free parking problems.
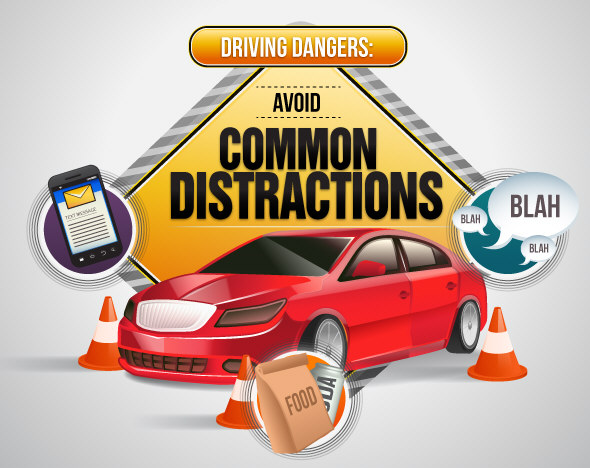
Beyond Texting: Avoid All Distractions While Driving
Driving distracted–even for a moment–can lead to a catastrophe. While texting is one thing that can take your eyes off the road, it’s not the only way drivers can become sidetracked. Eating, interacting with passengers, adjusting the radio and of course, engaging in multimedia interactions can all contribute to a less-than-focused driver…and that can be a very dangerous situation. Check out the infographic below by Allstate and consider taking the proper steps to reduce or eliminate these situations, and avoid common driving distractions.
Is Your Choice Of Car Going To Be The Death Of You?
The following infographic visually shows consumers the top selling cars in the world, the deadliest cars on the road, and past vehicle faux pas making the listed cars the “Killer Cars of All Time.”
America’s Addiction to Oil
America is severely addicted to fuel, and we’re not helping with our low gas prices and federal funding for highways instead of public transit. You may complain about the price of your fuel, but it’s nothing compared to countries like Turkey, which pay nearly $10 a gallon, or even compared to the international average, which we fall $2.72 below. Our cars drive 7 billion miles and use up 18 million barrels of fuel in a single day – a full third of the world total of 53 million barrels per day. How long can this continue?
The Most Exciting Car Ever Built
The Aventador Roadster, by Lamborghini, is one of the most exhilarating cars ever built. Check out the infographic below to learn more about this exiting car.
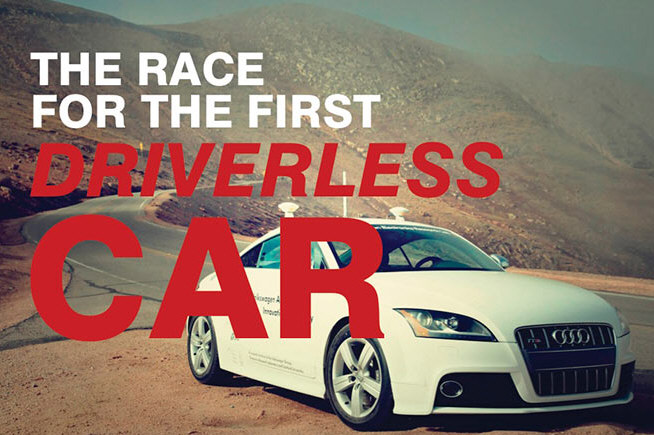
The Race for the First Driverless Car
How soon could the driverless car become a reality? When should motorists start paying serious attention? The answer could be sooner than you think! Learn more in this infographic.
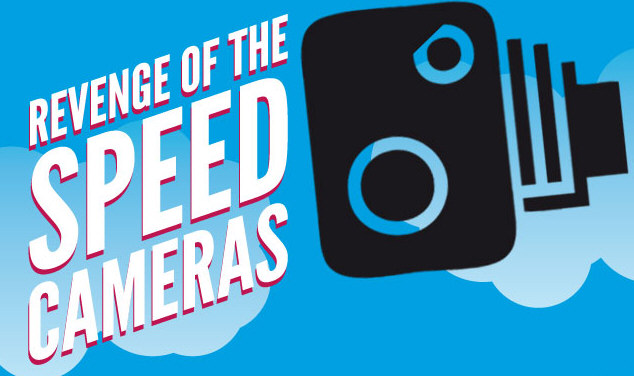
Revenge of the Speed Cameras
Amazingly, the UK has more speed cameras than Italy and Spain put together, and has more speed cameras policing its roads than Germany and France, two of the biggest countries in Europe. The UK’s speed cameras generate a massive £87m a year in profit for the treasury. Find out more shocking infographic facts, including the UK’s most lucrative speed cameras, in Revenge of the Speed Cameras by JMW.
Commuting to UCLA
UCLA Transportation produces an annual State of The Commute report that records and analyzes the commute behaviors of the UCLA community. The information in this infographic is based on figures generated from the 2012 State of The Commute report. UCLA Transportation supports the campus community by providing for safe and efficient commute options and mobility in an environmentally responsible manner.
10 Deadliest Counties for Illinois Drivers
This infographic provides important data about the most dangerous counties in Illinois for drivers. This data was compiled using information from the Illinois Dept. of Transportation and U.S. Census Bureau Illinois Quick Facts.
20 Of The Greatest Supercars From The Last 20 Years
The motor industry has come in leaps and bounds over the last twenty years. New technologies have allowed for bigger, better and faster supercars. We’ve seen ferocious Ferraris and beautiful Bugatti’s, but which was the best? In order to help you decide, Romans International has assembled the 20 greatest supercars from the last 20 years. Which is your favorite?
Free Parking Fallacies
Free parking isn’t exactly “free.” There is a high cost and we all pay for it in one way or another. The market value of America’s parking is over $310 billion and very little of that is ever collected directly. MyParkingSign has collected data from leading parking experts and it’s own sales to put together an infographic better explaining how the issues in America’s free parking problems.
Beyond Texting: Avoid All Distractions While Driving
Driving distracted–even for a moment–can lead to a catastrophe. While texting is one thing that can take your eyes off the road, it’s not the only way drivers can become sidetracked. Eating, interacting with passengers, adjusting the radio and of course, engaging in multimedia interactions can all contribute to a less-than-focused driver…and that can be a very dangerous situation. Check out the infographic below by Allstate and consider taking the proper steps to reduce or eliminate these situations, and avoid common driving distractions.
Is Your Choice Of Car Going To Be The Death Of You?
The following infographic visually shows consumers the top selling cars in the world, the deadliest cars on the road, and past vehicle faux pas making the listed cars the “Killer Cars of All Time.”
America’s Addiction to Oil
America is severely addicted to fuel, and we’re not helping with our low gas prices and federal funding for highways instead of public transit. You may complain about the price of your fuel, but it’s nothing compared to countries like Turkey, which pay nearly $10 a gallon, or even compared to the international average, which we fall $2.72 below. Our cars drive 7 billion miles and use up 18 million barrels of fuel in a single day – a full third of the world total of 53 million barrels per day. How long can this continue?
The Most Exciting Car Ever Built
The Aventador Roadster, by Lamborghini, is one of the most exhilarating cars ever built. Check out the infographic below to learn more about this exiting car.
The Race for the First Driverless Car
How soon could the driverless car become a reality? When should motorists start paying serious attention? The answer could be sooner than you think! Learn more in this infographic.
Revenge of the Speed Cameras
Amazingly, the UK has more speed cameras than Italy and Spain put together, and has more speed cameras policing its roads than Germany and France, two of the biggest countries in Europe. The UK’s speed cameras generate a massive £87m a year in profit for the treasury. Find out more shocking infographic facts, including the UK’s most lucrative speed cameras, in Revenge of the Speed Cameras by JMW.
Commuting to UCLA
UCLA Transportation produces an annual State of The Commute report that records and analyzes the commute behaviors of the UCLA community. The information in this infographic is based on figures generated from the 2012 State of The Commute report. UCLA Transportation supports the campus community by providing for safe and efficient commute options and mobility in an environmentally responsible manner.
Search 12,100+ Infographics!
Partners


Browse Archives By Category
Animated Infographics
Business Infographics
Career & Jobs Infographics
Education Infographics
Entertainment Industry Infographics
Environmental Infographics
Finance & Money Infographics
Food & Drink Infographics
Health Infographics
Historical Infographics
Home & Garden Infographics
Internet Infographics
Law and Legal Infographics
Lifestyle Infographics
Marketing Infographics
Offbeat Infographics
Parenting Infographics
Pets & Animals Infographics
Political Infographics
Shopping Infographics
Sports and Athletic Infographics
Technology Infographics
Transportation Infographics
Travel Infographics
Video Infographics