Transportation Infographics
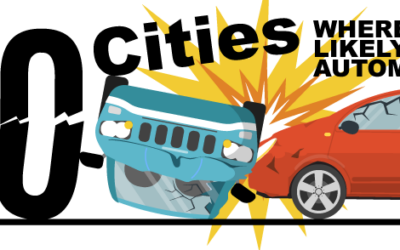
The 50 Cities Where You’re Most Likely to Get in an Automobile Accident
Anytime you’re driving in a car, there’s a small risk that you could get into an automobile accident, but is this risk higher in some cities around the country? When considering certain factors, some areas of the United States were found to have far worse drivers than others. In this infographic, AutomotiveTouchup mapped out the 50 U.S. cities where the likelihood of an automobile accident occurring is much higher than average.

The Longest (and Shortest) Interstate Highways Across the United States
The Interstate Highway System was created in 1956 to aid travel across the United States, assist with the transportation of goods throughout the country, and be used for emergency situations or quick troop deployment. The 77 interstate highways that make up the U.S. Interstate System cover thousands of miles. Learn which ones have the longest mileage and the shortest with this visual ranking.
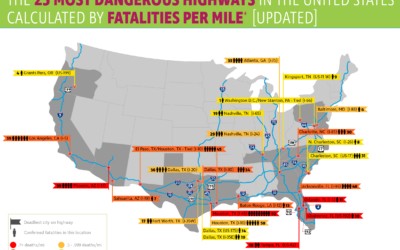
25 Most Dangerous Highways in the United States
Here is an infographic with visual map that shows which interstates across the US are the most dangerous by calculating fatalities per mile. Florida’s I4 takes the top spot in this graphic with 1.134 deaths per mile. Interesting to note these accidents happen most commonly on Sunday from 12am to 1am, leading one to suggest driving under the influence may play a big role.
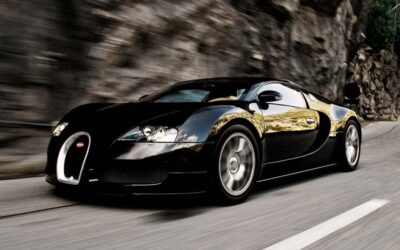
The Fastest Street-Legal Cars Ever Made by 40 Major Automakers
Here’s an infographic that ranks the fastest production cars from 40 major manufacturers based on their zero-to-60 acceleration speeds. Production vehicles are mass-produced identical models that are available for sale to the public and are able to be legally driven on public roads. While most of them are the latest models, there are a few gems from earlier generations that still reign supreme.

The Most Popular Car Colors Around the United States and the World
This infographic ranks the most popular car colors around the world. It also includes more detailed data for every state in the US. Since the 2 top favorites across the globe are white and black, the map of the US below shows what the 2nd favorite color is for each state. The graph also breaks down the top favorite color in each major metro area in the US, those colors are either white or black.

The Most Popular Car In Every Country Around The World
Some countries were found to be extremely loyal to one car brand, like Yemen, where nearly everyone in the country drives a Toyota. It came as no surprise to see that car brands tend to be the most popular in the countries where they hail from. For example, Germany and its surrounding countries are loyal to Volkswagen, for instance, while Italy favors Fiat.
Electric Car vs Gas Costs: Which Truly Saves You The Most Money?
Almost every major automaker has already invested billions of dollars into expanding their electric vehicle lineups. Within 20 years, it will probably be next to impossible to actually buy a brand new car that still runs on plain ol’ gasoline. Until that day comes, though, the debate between electric car vs gas costs rages on: which one will save you the most money overall?
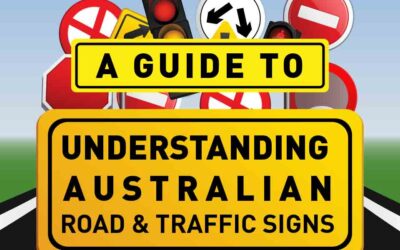
Understanding Australian Road and Traffic Signs
Road and traffic signs are designed to keep both drivers and pedestrians safe on roads. In Australia: there are three main types of signs – Regulatory, Warning and Informational. However, different states and areas might have unique signs that are less common. Real Insurance has organized the key road signs into an infographic that can be easily digested and shared around to keep everyone safe.

UK Vehicle Theft & Recovery Statistics with Thatcham GPS Trackers
After a decade of decline, vehicle theft numbers appear to be increasing all over the UK. The good news is, thanks to the improvements in car security technology it’s possible to take precautions. Below are the staggering statistics of vehicle theft in the UK in recent years.
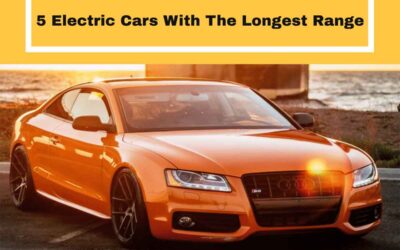
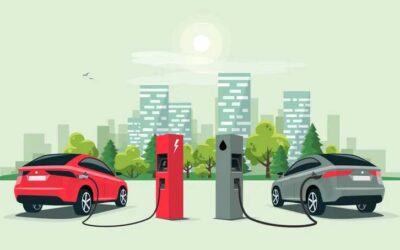
The 5 Electric Cars With The Longest Range
More drivers than ever are considering making the switch to electric vehicles as they are more cost-effective, better for the environment, and may even be safer. But how far can they travel? What is their range before having to re-charge? This infographic looks at 5 electric cars With the longest range.
The 50 Cities Where You’re Most Likely to Get in an Automobile Accident
Anytime you’re driving in a car, there’s a small risk that you could get into an automobile accident, but is this risk higher in some cities around the country? When considering certain factors, some areas of the United States were found to have far worse drivers than others. In this infographic, AutomotiveTouchup mapped out the 50 U.S. cities where the likelihood of an automobile accident occurring is much higher than average.
The Longest (and Shortest) Interstate Highways Across the United States
The Interstate Highway System was created in 1956 to aid travel across the United States, assist with the transportation of goods throughout the country, and be used for emergency situations or quick troop deployment. The 77 interstate highways that make up the U.S. Interstate System cover thousands of miles. Learn which ones have the longest mileage and the shortest with this visual ranking.
25 Most Dangerous Highways in the United States
Here is an infographic with visual map that shows which interstates across the US are the most dangerous by calculating fatalities per mile. Florida’s I4 takes the top spot in this graphic with 1.134 deaths per mile. Interesting to note these accidents happen most commonly on Sunday from 12am to 1am, leading one to suggest driving under the influence may play a big role.
The Fastest Street-Legal Cars Ever Made by 40 Major Automakers
Here’s an infographic that ranks the fastest production cars from 40 major manufacturers based on their zero-to-60 acceleration speeds. Production vehicles are mass-produced identical models that are available for sale to the public and are able to be legally driven on public roads. While most of them are the latest models, there are a few gems from earlier generations that still reign supreme.
The Most Popular Car Colors Around the United States and the World
This infographic ranks the most popular car colors around the world. It also includes more detailed data for every state in the US. Since the 2 top favorites across the globe are white and black, the map of the US below shows what the 2nd favorite color is for each state. The graph also breaks down the top favorite color in each major metro area in the US, those colors are either white or black.
The Most Popular Car In Every Country Around The World
Some countries were found to be extremely loyal to one car brand, like Yemen, where nearly everyone in the country drives a Toyota. It came as no surprise to see that car brands tend to be the most popular in the countries where they hail from. For example, Germany and its surrounding countries are loyal to Volkswagen, for instance, while Italy favors Fiat.
Electric Car vs Gas Costs: Which Truly Saves You The Most Money?
Almost every major automaker has already invested billions of dollars into expanding their electric vehicle lineups. Within 20 years, it will probably be next to impossible to actually buy a brand new car that still runs on plain ol’ gasoline. Until that day comes, though, the debate between electric car vs gas costs rages on: which one will save you the most money overall?
Understanding Australian Road and Traffic Signs
Road and traffic signs are designed to keep both drivers and pedestrians safe on roads. In Australia: there are three main types of signs – Regulatory, Warning and Informational. However, different states and areas might have unique signs that are less common. Real Insurance has organized the key road signs into an infographic that can be easily digested and shared around to keep everyone safe.
UK Vehicle Theft & Recovery Statistics with Thatcham GPS Trackers
After a decade of decline, vehicle theft numbers appear to be increasing all over the UK. The good news is, thanks to the improvements in car security technology it’s possible to take precautions. Below are the staggering statistics of vehicle theft in the UK in recent years.
The 5 Electric Cars With The Longest Range
More drivers than ever are considering making the switch to electric vehicles as they are more cost-effective, better for the environment, and may even be safer. But how far can they travel? What is their range before having to re-charge? This infographic looks at 5 electric cars With the longest range.
Search 12,100+ Infographics!
Partners


Browse Archives By Category
Animated Infographics
Business Infographics
Career & Jobs Infographics
Education Infographics
Entertainment Industry Infographics
Environmental Infographics
Finance & Money Infographics
Food & Drink Infographics
Health Infographics
Historical Infographics
Home & Garden Infographics
Internet Infographics
Law and Legal Infographics
Lifestyle Infographics
Marketing Infographics
Offbeat Infographics
Parenting Infographics
Pets & Animals Infographics
Political Infographics
Shopping Infographics
Sports and Athletic Infographics
Technology Infographics
Transportation Infographics
Travel Infographics
Video Infographics