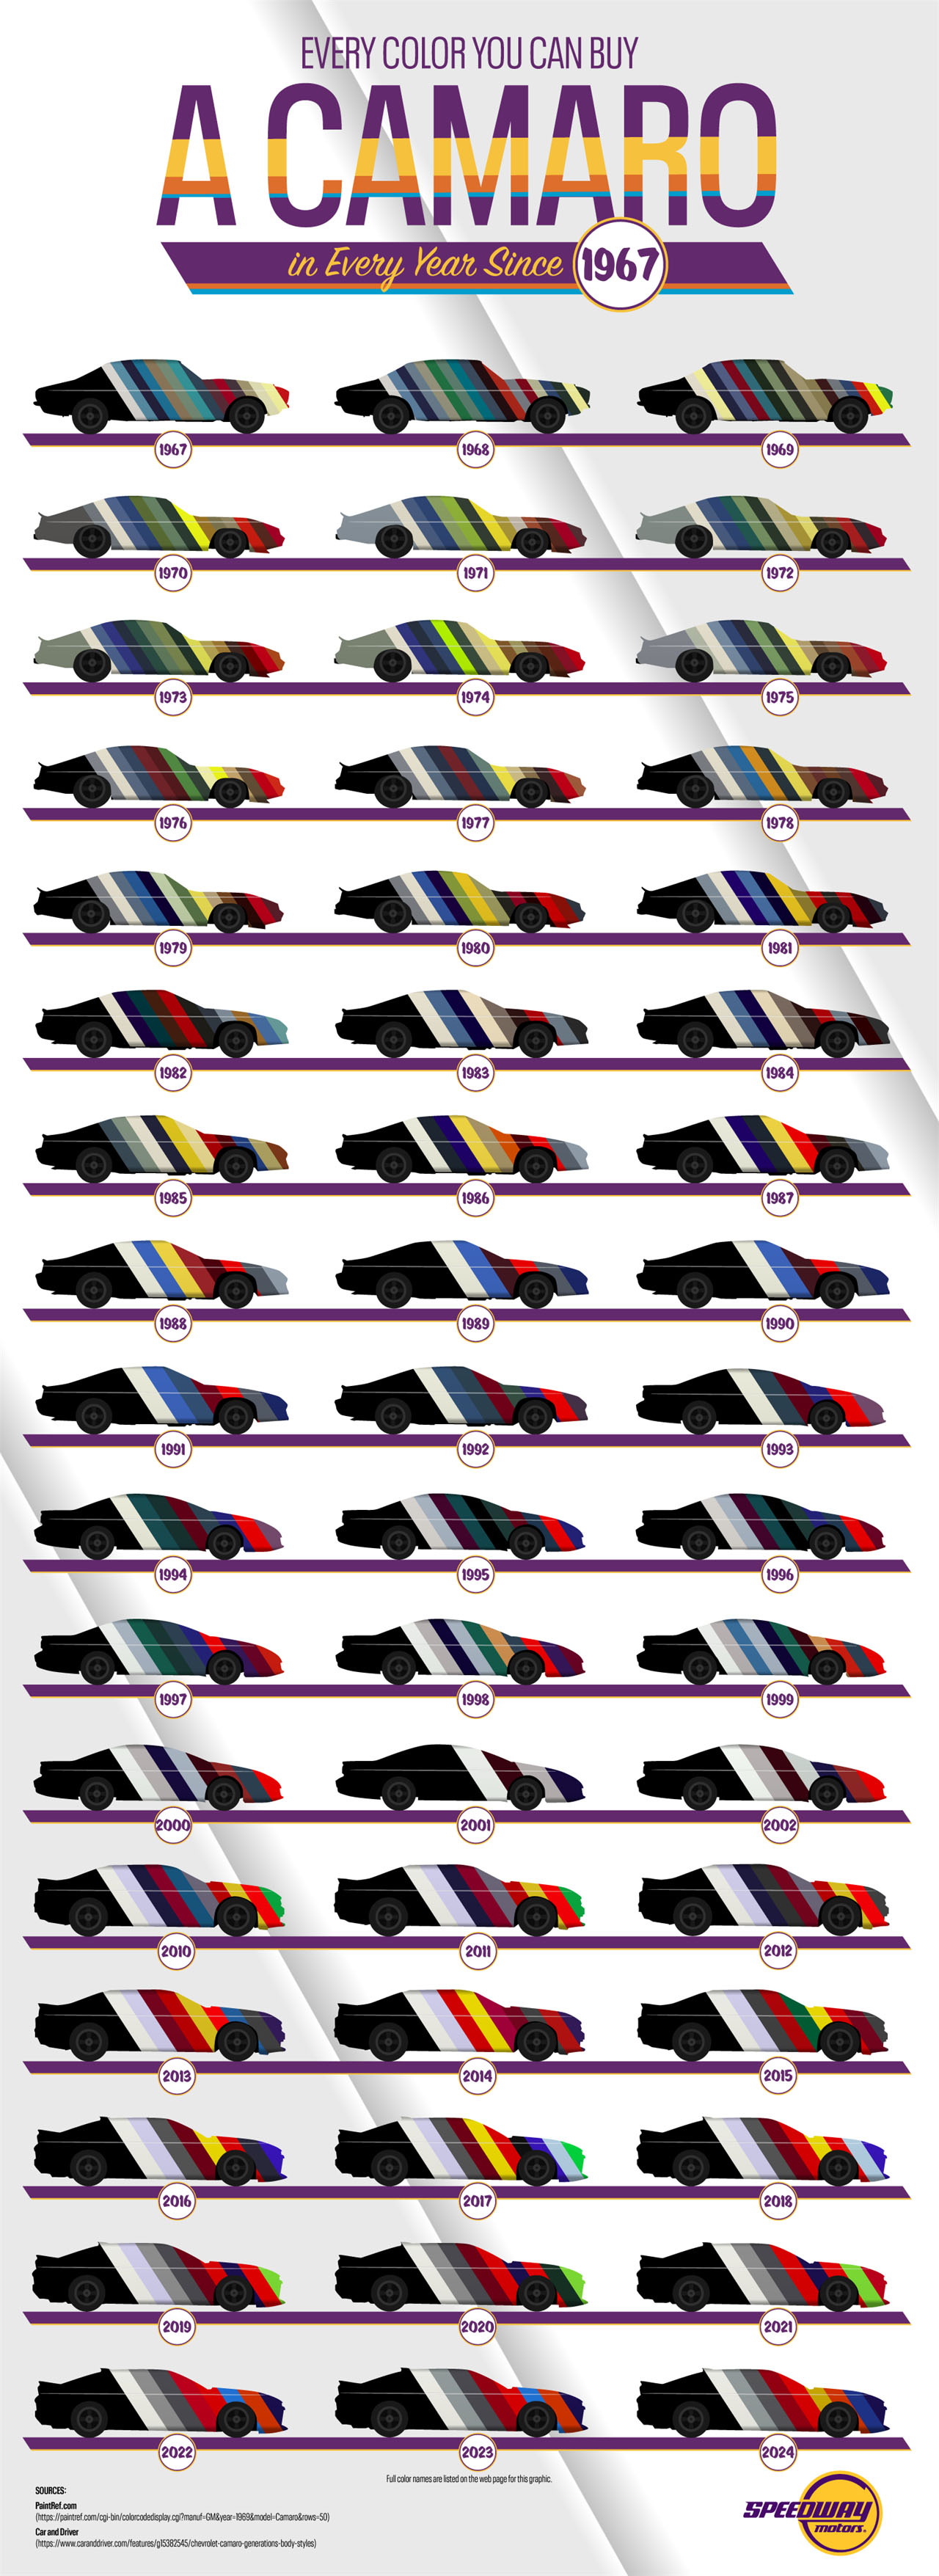
The following graphic from Speedway Motors is an excellent visualization of automotive data and history. It showcases the Camaro and every shade of color it was available in each year. That’s decades of history represented since 1967.
The way this data is organized in a chronological layout and stripes of color lets the visual elements tell us a story about changing tastes and trends in automobiles over the decades.


