Real estate costs in the United States are on an unprecedented upward trajectory. Around the nation, millions of Millennials and Gen Zers are renting rather than buying as home prices are too high and real estate inventory is at an all time low.
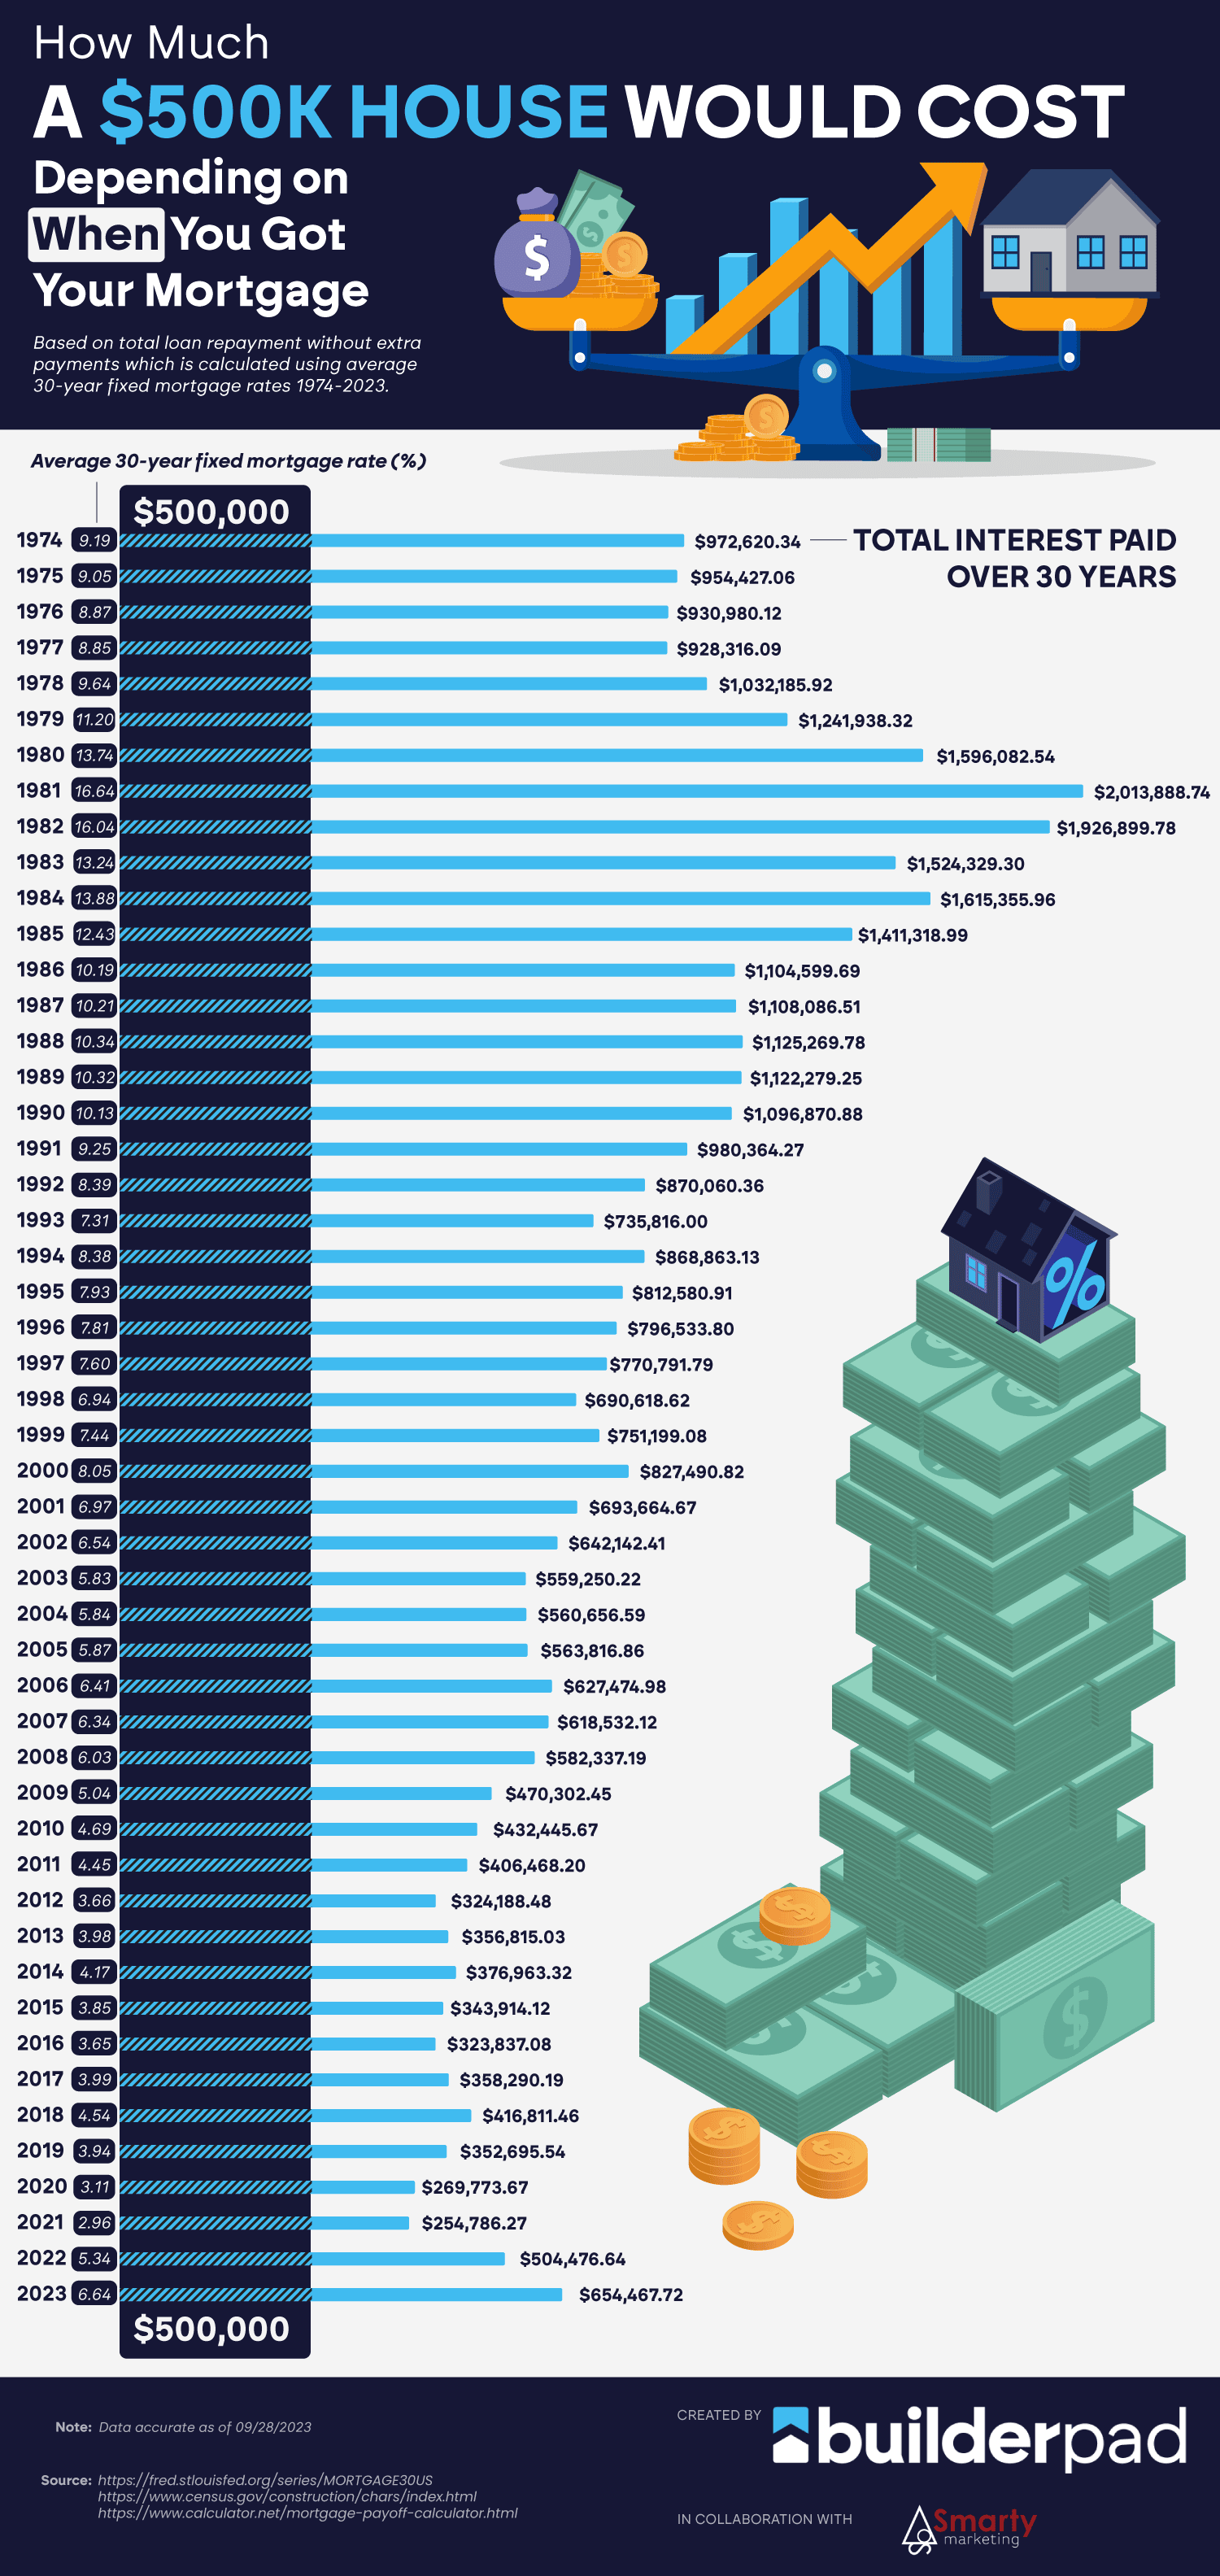
This infographic from BuilderPad is shining a light on the issue by revealing which states have the fastest-increasing real estate prices. To look at it from a unique perspective, the infographic compares how big a $500,000 house in 2018 was versus how big it is in 2023. Following the initial infographic is an additional one that looks at mortgage rates for a $500k house.
The results are eye-opening.
[Click here for full size version]