


Search 12,100+ Infographics!
Learning With Origami: The Easy Way
Ever wondered what was possible with merely a blank piece of paper? Of course you have. Although – having thought about it – it’s not a lot, right? Well, prepare to be pleasantly surprised because there’s a whole lot more to that blank piece of paper than you may have ever realized. Check out how to make a list worth of origami designs varying from a romantic tulip, an office tie, a make-believe strawberry, a bat, a tadpole and a rabbit’s face with still many parts to come.
Facebook Cheat Sheet: Image Size and Dimensions
TechWyse has created the ultimate Facebook sizing cheat sheet. This infographic is a handy reference tool especially for the designers who need to know image sizes for Facebook fan pages. Use this cheat sheet and you’ll never have to guess the dimensions again.
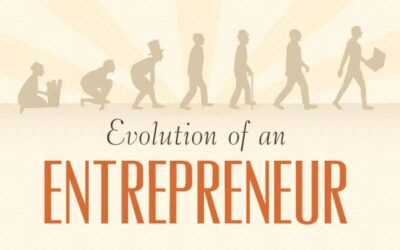
The Evolution of an Entrepreneur
When we hear the word “entrepreneur,” we tend to conjure up images of tech magnates or other computer-based startup business owners. However, the process of small business ownership goes back much farther, with roots stemming as far back as the Middle Ages. To see how the field of entrepreneurship has changed throughout history – as well as what the startup culture might look like for future generations of enterprising business owners – check out the following infographic.
How to Know She is Flirting With You
Men, are you having trouble identifying if and when a girl might be flirting with you? Well, Dating Advice Guy has a special treat for you… this infographic might put you in the right direction of finding that special someone! Learn how to understand what a lady might be saying with anything other than words.
Uncle Sam Wants You To Hack For the US Government
Have you ever wanted to become a hacker? Well, you’re in luck. The government is looking for students to counter cyber terrorism, or otherwise known as white hat hackers. Check out the infographic below to learn more about how the government is trying to beef up their cyber security workforce.
Turning Up the Heat
Almost half (42%) of home energy costs come from heating and cooling. Having an efficient heating and cooling system can save you money. Check out the infographic below presented by AAA Heating & Air Conditioning to learn more about heating systems and how upgrading could save you money down the road.
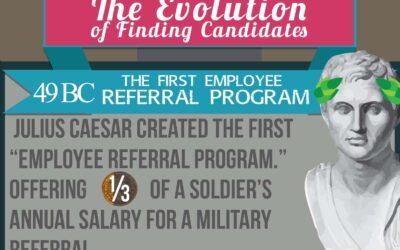
The Evolution of Finding Candidates
Finding job candidates has changed quite a bit since the time of Caesar. But one thing that’s remained the same – managers want to hire the right candidate. Take a look at this infographic from Hireology for facts and stats on how hiring has changed.

New vs Old Media Billionaires
We all know that new media is growing at a much faster pace than old media businesses. The folks at Staff.com thought it would be interesting to see just how this is affecting the media billionaires. How much faster did these new media billionaires make their money?

How You Set In Motion Coffee’s Global Business
The infographic from FinancesOnline.com paints a picture of you, the coffee-loving consumer, and your connection to Bushogo – a typical small-scale African coffee farmer. In the middle are all the other players that move coffee along a supply chain until Bushogo’s harvest of beans steams as a delicious brew in your cup. Who’s making money from your daily frap outlay?
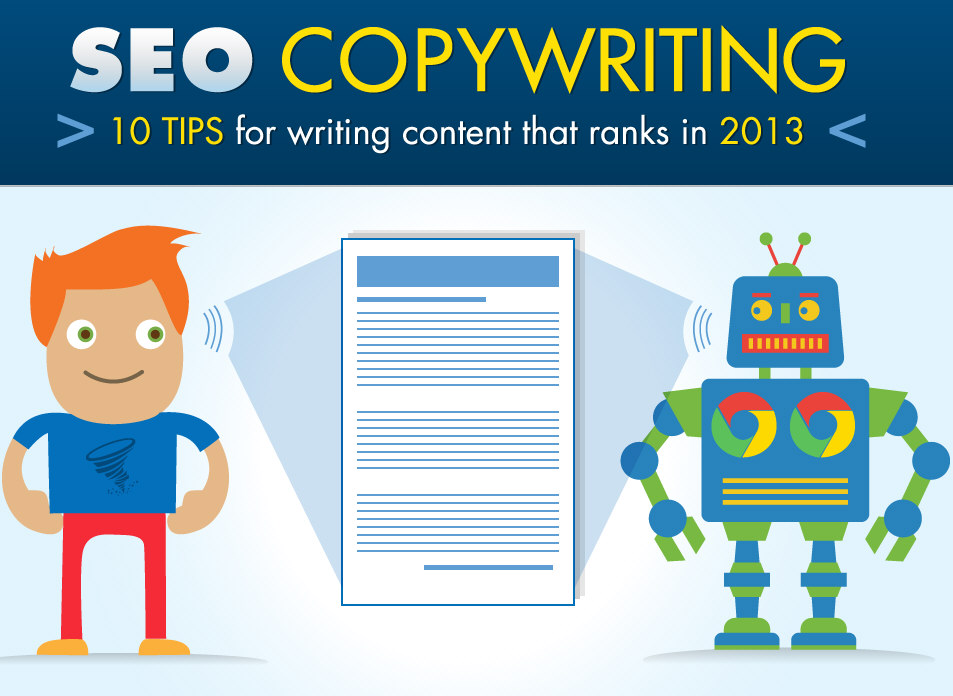
SEO Copywriting – 10 Tips for Writing Content that Ranks in 2013
Because of all the algorithm updates Google has pushed in recent years, a lot of the old tricks and best practices don’t work anymore. Moreover, it’s really hard to keep track of what does work. This infographic gives you solid 10 tips for writing content that ranks in 2013.
Learning With Origami: The Easy Way
Ever wondered what was possible with merely a blank piece of paper? Of course you have. Although – having thought about it – it’s not a lot, right? Well, prepare to be pleasantly surprised because there’s a whole lot more to that blank piece of paper than you may have ever realized. Check out how to make a list worth of origami designs varying from a romantic tulip, an office tie, a make-believe strawberry, a bat, a tadpole and a rabbit’s face with still many parts to come.
Facebook Cheat Sheet: Image Size and Dimensions
TechWyse has created the ultimate Facebook sizing cheat sheet. This infographic is a handy reference tool especially for the designers who need to know image sizes for Facebook fan pages. Use this cheat sheet and you’ll never have to guess the dimensions again.
The Evolution of an Entrepreneur
When we hear the word “entrepreneur,” we tend to conjure up images of tech magnates or other computer-based startup business owners. However, the process of small business ownership goes back much farther, with roots stemming as far back as the Middle Ages. To see how the field of entrepreneurship has changed throughout history – as well as what the startup culture might look like for future generations of enterprising business owners – check out the following infographic.
How to Know She is Flirting With You
Men, are you having trouble identifying if and when a girl might be flirting with you? Well, Dating Advice Guy has a special treat for you… this infographic might put you in the right direction of finding that special someone! Learn how to understand what a lady might be saying with anything other than words.
Uncle Sam Wants You To Hack For the US Government
Have you ever wanted to become a hacker? Well, you’re in luck. The government is looking for students to counter cyber terrorism, or otherwise known as white hat hackers. Check out the infographic below to learn more about how the government is trying to beef up their cyber security workforce.
Turning Up the Heat
Almost half (42%) of home energy costs come from heating and cooling. Having an efficient heating and cooling system can save you money. Check out the infographic below presented by AAA Heating & Air Conditioning to learn more about heating systems and how upgrading could save you money down the road.
The Evolution of Finding Candidates
Finding job candidates has changed quite a bit since the time of Caesar. But one thing that’s remained the same – managers want to hire the right candidate. Take a look at this infographic from Hireology for facts and stats on how hiring has changed.
New vs Old Media Billionaires
We all know that new media is growing at a much faster pace than old media businesses. The folks at Staff.com thought it would be interesting to see just how this is affecting the media billionaires. How much faster did these new media billionaires make their money?
How You Set In Motion Coffee’s Global Business
The infographic from FinancesOnline.com paints a picture of you, the coffee-loving consumer, and your connection to Bushogo – a typical small-scale African coffee farmer. In the middle are all the other players that move coffee along a supply chain until Bushogo’s harvest of beans steams as a delicious brew in your cup. Who’s making money from your daily frap outlay?
SEO Copywriting – 10 Tips for Writing Content that Ranks in 2013
Because of all the algorithm updates Google has pushed in recent years, a lot of the old tricks and best practices don’t work anymore. Moreover, it’s really hard to keep track of what does work. This infographic gives you solid 10 tips for writing content that ranks in 2013.
Partners


Browse Archives By Category
Animated Infographics
Business Infographics
Career & Jobs Infographics
Education Infographics
Entertainment Industry Infographics
Environmental Infographics
Finance & Money Infographics
Food & Drink Infographics
Health Infographics
Historical Infographics
Home & Garden Infographics
Internet Infographics
Law and Legal Infographics
Lifestyle Infographics
Marketing Infographics
Offbeat Infographics
Parenting Infographics
Pets & Animals Infographics
Political Infographics
Shopping Infographics
Sports and Athletic Infographics
Technology Infographics
Transportation Infographics
Travel Infographics
Video Infographics