


Search 12,100+ Infographics!

Preschool Popularity
Preschool has become the preference of American parents, with more than half enrolling their young children into these educationally focused programs for their many developmental, behavioral, and social benefits. Preschool is continually proven to give children every advantage by offering a developmentally appropriate curriculum, character education, health and fitness exercises, and technology education.
Can Online Gambling Pay the Nation’s Bills?
A study in March 2012 found that the UK’s online gambling industry employed 7,204 people to help cater for this growing obsession. From football to poker, there are always events going on that encourage gambling. This infographic looks at the effect this has on the economy.
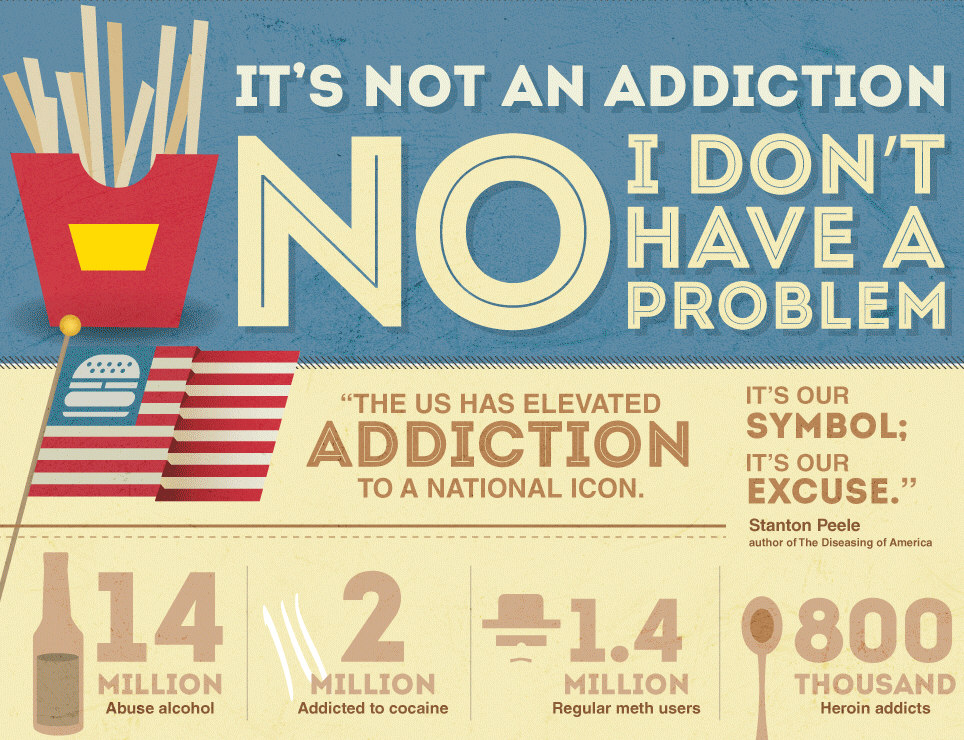
Rogue Addictions: No I Don’t Have A Problem
“The U.S. has elevated addiction to a national icon,” says author of The Diseasing of America, Stanton Peele, “It’s our symbol; it’s our excuse.” An addiction is a powerful disease that eliminates free will. They can be developed over a long or short period of time, they can take on many forms. However, society recognizes the need for treatment with certain addictions more than others. Addictions to drugs, alcohol or smoking are recognized, but there are many that are less recognized. Addictions to victimization, sex, fear, work, food, distrust and control often go overlooked or ignored.

The Rise of a Pop Superstar
Rihanna was not always the sexy, intriguing superstar she is today. She was actually very shy as a child, and found an outlet through singing and performing for her friends. Learn more about Rihanna’s rise to pop stardom by checking out the infographic below.
Menopause By the Numbers
“Menopause By the Numbers” is a fun interactive way to learn about menopause and it’s symptoms. In what age range is it typical for natural menopause to occur? How many women reach menopause in the United States each day? What percentage of women experience menopause symptoms? What are the five most common menopause symptoms? What percentage of women report using dietary supplements to relieve menopause symptoms?
The Ins and Outs of Blood Donation
Approximately 4.5 million lives are saved each year through blood transfusions. Check out the infographic below presented by InsuranceQuotes to learn more interesting facts about blood donation.

How to Ensure Your Startup’s Survival
More than one third of all startup businesses fail within the first two years of opening. With such a potentially promising business model, what is going wrong? And what can you do to prevent your own startup from falling flat? Salesforce is here to help: learn what causes startup failure and how to make your business survive and thrive in the future.
Welcome to 21st Century Health
Some things just get better with time. In the case of American health and medicine technology, this is especially true. This infographic explores four main ways Americans can be grateful for their health. It looks at the condition of healthcare and medicine in the 1900’s and how vastly it has improved over the century.
United States Flag Laws
A country’s flag is a source of great pride, whether it’s being flown on a national holiday or being waved in the air at a event. This is certainly no exception for the United States. The U.S. flag has become just as much a part of the American culture and identity as baseball, apple pie and fruited plains.
A Quick Recipe For Developing a Good Mobile App
Every great food dish requires a recipe, but according to Intellicore of Scotland this rule does not just apply to food but also to apps! In the following infographic you’ll find 8 useful ingredients that may help you serve a quality mobile application at your next dinner party.
Preschool Popularity
Preschool has become the preference of American parents, with more than half enrolling their young children into these educationally focused programs for their many developmental, behavioral, and social benefits. Preschool is continually proven to give children every advantage by offering a developmentally appropriate curriculum, character education, health and fitness exercises, and technology education.
Can Online Gambling Pay the Nation’s Bills?
A study in March 2012 found that the UK’s online gambling industry employed 7,204 people to help cater for this growing obsession. From football to poker, there are always events going on that encourage gambling. This infographic looks at the effect this has on the economy.
Rogue Addictions: No I Don’t Have A Problem
“The U.S. has elevated addiction to a national icon,” says author of The Diseasing of America, Stanton Peele, “It’s our symbol; it’s our excuse.” An addiction is a powerful disease that eliminates free will. They can be developed over a long or short period of time, they can take on many forms. However, society recognizes the need for treatment with certain addictions more than others. Addictions to drugs, alcohol or smoking are recognized, but there are many that are less recognized. Addictions to victimization, sex, fear, work, food, distrust and control often go overlooked or ignored.
The Rise of a Pop Superstar
Rihanna was not always the sexy, intriguing superstar she is today. She was actually very shy as a child, and found an outlet through singing and performing for her friends. Learn more about Rihanna’s rise to pop stardom by checking out the infographic below.
Menopause By the Numbers
“Menopause By the Numbers” is a fun interactive way to learn about menopause and it’s symptoms. In what age range is it typical for natural menopause to occur? How many women reach menopause in the United States each day? What percentage of women experience menopause symptoms? What are the five most common menopause symptoms? What percentage of women report using dietary supplements to relieve menopause symptoms?
The Ins and Outs of Blood Donation
Approximately 4.5 million lives are saved each year through blood transfusions. Check out the infographic below presented by InsuranceQuotes to learn more interesting facts about blood donation.
How to Ensure Your Startup’s Survival
More than one third of all startup businesses fail within the first two years of opening. With such a potentially promising business model, what is going wrong? And what can you do to prevent your own startup from falling flat? Salesforce is here to help: learn what causes startup failure and how to make your business survive and thrive in the future.
Welcome to 21st Century Health
Some things just get better with time. In the case of American health and medicine technology, this is especially true. This infographic explores four main ways Americans can be grateful for their health. It looks at the condition of healthcare and medicine in the 1900’s and how vastly it has improved over the century.
United States Flag Laws
A country’s flag is a source of great pride, whether it’s being flown on a national holiday or being waved in the air at a event. This is certainly no exception for the United States. The U.S. flag has become just as much a part of the American culture and identity as baseball, apple pie and fruited plains.
A Quick Recipe For Developing a Good Mobile App
Every great food dish requires a recipe, but according to Intellicore of Scotland this rule does not just apply to food but also to apps! In the following infographic you’ll find 8 useful ingredients that may help you serve a quality mobile application at your next dinner party.
Partners


Browse Archives By Category
Animated Infographics
Business Infographics
Career & Jobs Infographics
Education Infographics
Entertainment Industry Infographics
Environmental Infographics
Finance & Money Infographics
Food & Drink Infographics
Health Infographics
Historical Infographics
Home & Garden Infographics
Internet Infographics
Law and Legal Infographics
Lifestyle Infographics
Marketing Infographics
Offbeat Infographics
Parenting Infographics
Pets & Animals Infographics
Political Infographics
Shopping Infographics
Sports and Athletic Infographics
Technology Infographics
Transportation Infographics
Travel Infographics
Video Infographics