


Search 12,100+ Infographics!
Earth Day
It’s that time of year again — time to give our dear home, Mother Earth, some love. It’s sad that many people only recognize our world and the state it is in once a year. Want to know more about the place we call home? Check out this infographic from eReplacementParts.com for facts, history and scary statistics.
Navigating the Future of Industry
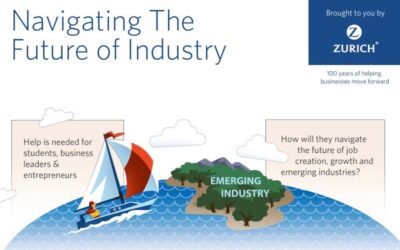
Preparing for the future of industry can be daunting. This infographic presented by Zurich takes a look at how students, business leaders and entrepreneurs can navigate the future of industry.

YouTube Sensations – Where Are They Now?
In celebration of Psy taking the crown for producing the first video to hit and surpass one billion views on YouTube, here is an infographic with a compilation of the greatest YouTube video sensations and viral videos and where they are now.
Formal Degree vs. Self Taught
Formal degree or self taught – which is better? A carefully designed course, filled with modules covering the industry’s most commonly requested skills; or hard work and self application, learning techniques as and when required?

What Is Your Greatest Footprint? (Carbon vs Water)
The average Irish citizen creates 4,855 cubic metres of CO2E per year. They also use 1,301 cubic metres of water per year, making their carbon footprint 3.75 times as big as their water footprint. This infographic from Calor Gas looks at ways to try and reduce these.
The Daze After Tomorrow
We’ve turned form Greek oracles to biblical prophets to scientists to science fiction writers to today’s futurists to get a glimpse of what’s to come. Or maybe not. Sometimes the seers need glasses, or contracts of Lasik or whatever comes next in vision correction. We don’t know; we can’t see that far ahead.
The 7 Project Manager Personalities: Which One Are You?
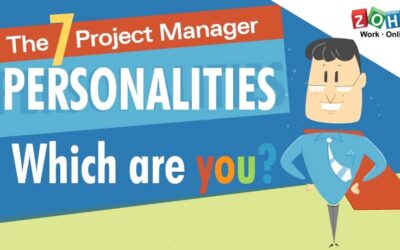
Zoho Blogs has put together an infographic of “7 Project Manager Personality Types,” detailing the essential characteristics of each. Whether you or your PM is the type of “Micro-Manager” or “Mentor”, keeping an eye out for these particular traits will ease interpersonal relationships like no online or mobile app can.
Protecting Intellectual Property Rights
Probably the best way to protect an eBook is by using a secure DRM system like Adobe Content Server 4 or a much more affordable option like EditionGuard. These systems can make it more difficult for pirates to take advantage if eBooks and the additional security may just cause them to turn their attention to other eBooks that do not have the same level of protection. DRM systems aren’t impossible to defeat but sometimes simply making it harder for “pirates” is enough deterrent.
Social Gaming Industry – Statistics & Trends
The following infographic “Social Gaming Industry – Statistics & Trends ” from GoGulf.com provides information about social gamers, worldwide social gaming market , the monetization of the social Gaming industry and lot more.
The Dirt: The Truth About Home Cleaning Habits
We’ve turned the corner into spring — and for many people, that means spring cleaning time is here. Find out the latest home cleaning insights brought to you by Neato Robotics that shed light on the truth about home cleaning habits.
Earth Day
It’s that time of year again — time to give our dear home, Mother Earth, some love. It’s sad that many people only recognize our world and the state it is in once a year. Want to know more about the place we call home? Check out this infographic from eReplacementParts.com for facts, history and scary statistics.
Navigating the Future of Industry
Preparing for the future of industry can be daunting. This infographic presented by Zurich takes a look at how students, business leaders and entrepreneurs can navigate the future of industry.
YouTube Sensations – Where Are They Now?
In celebration of Psy taking the crown for producing the first video to hit and surpass one billion views on YouTube, here is an infographic with a compilation of the greatest YouTube video sensations and viral videos and where they are now.
Formal Degree vs. Self Taught
Formal degree or self taught – which is better? A carefully designed course, filled with modules covering the industry’s most commonly requested skills; or hard work and self application, learning techniques as and when required?
What Is Your Greatest Footprint? (Carbon vs Water)
The average Irish citizen creates 4,855 cubic metres of CO2E per year. They also use 1,301 cubic metres of water per year, making their carbon footprint 3.75 times as big as their water footprint. This infographic from Calor Gas looks at ways to try and reduce these.
The Daze After Tomorrow
We’ve turned form Greek oracles to biblical prophets to scientists to science fiction writers to today’s futurists to get a glimpse of what’s to come. Or maybe not. Sometimes the seers need glasses, or contracts of Lasik or whatever comes next in vision correction. We don’t know; we can’t see that far ahead.
The 7 Project Manager Personalities: Which One Are You?
Zoho Blogs has put together an infographic of “7 Project Manager Personality Types,” detailing the essential characteristics of each. Whether you or your PM is the type of “Micro-Manager” or “Mentor”, keeping an eye out for these particular traits will ease interpersonal relationships like no online or mobile app can.
Protecting Intellectual Property Rights
Probably the best way to protect an eBook is by using a secure DRM system like Adobe Content Server 4 or a much more affordable option like EditionGuard. These systems can make it more difficult for pirates to take advantage if eBooks and the additional security may just cause them to turn their attention to other eBooks that do not have the same level of protection. DRM systems aren’t impossible to defeat but sometimes simply making it harder for “pirates” is enough deterrent.
Social Gaming Industry – Statistics & Trends
The following infographic “Social Gaming Industry – Statistics & Trends ” from GoGulf.com provides information about social gamers, worldwide social gaming market , the monetization of the social Gaming industry and lot more.
The Dirt: The Truth About Home Cleaning Habits
We’ve turned the corner into spring — and for many people, that means spring cleaning time is here. Find out the latest home cleaning insights brought to you by Neato Robotics that shed light on the truth about home cleaning habits.
Partners


Browse Archives By Category
Animated Infographics
Business Infographics
Career & Jobs Infographics
Education Infographics
Entertainment Industry Infographics
Environmental Infographics
Finance & Money Infographics
Food & Drink Infographics
Health Infographics
Historical Infographics
Home & Garden Infographics
Internet Infographics
Law and Legal Infographics
Lifestyle Infographics
Marketing Infographics
Offbeat Infographics
Parenting Infographics
Pets & Animals Infographics
Political Infographics
Shopping Infographics
Sports and Athletic Infographics
Technology Infographics
Transportation Infographics
Travel Infographics
Video Infographics