


Search 12,100+ Infographics!
US Travel Trends Q1 2013
Looks like NYC is the place to visit this year. NYC topped the list of most searched and traveled to destinations for Q1 2013. Check out the infographic below presented by Sojern to learn more bout travel trends for Q1 of 2013.
Virgin London Marathon 2013
The London Marathon is here in which spectators will see thousands of professional athletes and enthusiastic runners take to the streets of London for the annual sporting event. While some participants run with victory and record breaking in mind, others see the race as one of the UK’s most famous fancy dress affairs, flaunting wacky costumes and light-hearted antics for very real charities.
GMOs: The Walking Dead of the Food Industry
You might be asking yourself what is a GMO and should I be concerned? GMO stands for “genetically modified food” and YES! You should be concerned. Today 80% of all packaged food in the United States contains GMO’s. Despite their wide usage in foods, there have not been long-term health studies conducted on the safety of GMO’s. Study the following infographic to learn more about this important issue.
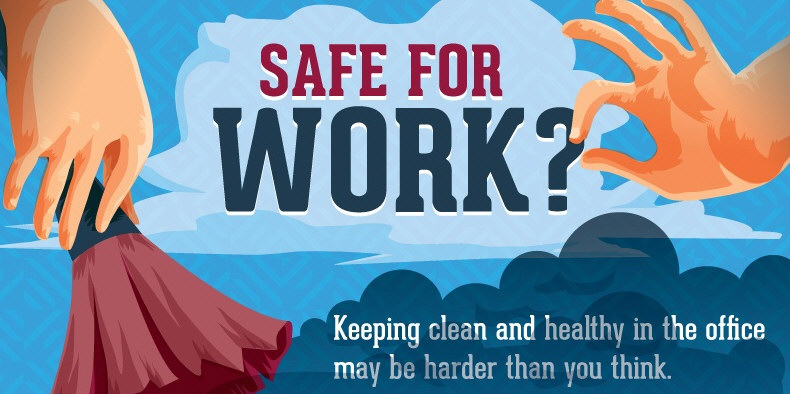
Is Your Office Safe For Work?
Keeping clean and healthy in the office may be harder than you think. Did you know that 1 in 3 office workers have witnessed co-workers leaving restrooms without washing their hands? Or how about 53% of Americans don’t wash their hands after exchanging money? Or even The average person touches 300 surfaces every 30 minutes, exposing themselves to 840,000 germs?
12 Unusual Social Networking Sites
Twitter and Facebook have huge audiences, but smaller social networking sites for niche audiences from mustache lovers to knitters are picking up steam, with new ones popping up all the time. MyLife.com tracked down 12 unique sites for specific interest groups you might want to join or share with your cat-loving friend.

Where Are Payday Loans Banned?
Payday loans are a highly contested form of consumer lending. Advocate groups fight to protect them while consumer groups work to limit or eliminate them completely. Currently, 12 states have laws that either ban payday loans or have strict lending laws which make them unprofitable in the state.
The Many Faces of a Marketing Team
Who are the people behind marketing campaigns and how do they collaborate? In the fast-paced world of digital marketing, keeping everyone on the same page is no mean task. By understanding how marketers coordinate & collaborate, teams can stay in sync and work better, together. Take a look at this infographic from Brightpod to see the many faces of a marketing team! It provides a fun take on the different types of marketers, their favorite tools, what they read and how they collaborate.
The Road to The Wedding
If you are thinking about getting married or would just like to know what the road to wedding looks like, this infographic will definitely come to the rescue. It takes a look at different factors when it comes to making your way through dating scene into wedding. For example – Did you know that you are twice likely to find a date through friends and family than at a bar? What about the fact that 63% of married couples met through friends?

The Evolution of Video Games
Simple video games have been around since 1947, but they have come a long way since then. This infographic presented by National Geographic takes a look at the evolution of video games. Check it out below to learn more.

50 Unbelievable Facts About Earth
You may have lived on Earth all your life, but how much do you really know about it? Did you know that Earth is the only planet in the Solar System with plate tectonics, or that the continents move 2cm every year? For more fascinating facts check out this infographic by Giraffe Childcare.
US Travel Trends Q1 2013
Looks like NYC is the place to visit this year. NYC topped the list of most searched and traveled to destinations for Q1 2013. Check out the infographic below presented by Sojern to learn more bout travel trends for Q1 of 2013.
Virgin London Marathon 2013
The London Marathon is here in which spectators will see thousands of professional athletes and enthusiastic runners take to the streets of London for the annual sporting event. While some participants run with victory and record breaking in mind, others see the race as one of the UK’s most famous fancy dress affairs, flaunting wacky costumes and light-hearted antics for very real charities.
GMOs: The Walking Dead of the Food Industry
You might be asking yourself what is a GMO and should I be concerned? GMO stands for “genetically modified food” and YES! You should be concerned. Today 80% of all packaged food in the United States contains GMO’s. Despite their wide usage in foods, there have not been long-term health studies conducted on the safety of GMO’s. Study the following infographic to learn more about this important issue.
Is Your Office Safe For Work?
Keeping clean and healthy in the office may be harder than you think. Did you know that 1 in 3 office workers have witnessed co-workers leaving restrooms without washing their hands? Or how about 53% of Americans don’t wash their hands after exchanging money? Or even The average person touches 300 surfaces every 30 minutes, exposing themselves to 840,000 germs?
12 Unusual Social Networking Sites
Twitter and Facebook have huge audiences, but smaller social networking sites for niche audiences from mustache lovers to knitters are picking up steam, with new ones popping up all the time. MyLife.com tracked down 12 unique sites for specific interest groups you might want to join or share with your cat-loving friend.
Where Are Payday Loans Banned?
Payday loans are a highly contested form of consumer lending. Advocate groups fight to protect them while consumer groups work to limit or eliminate them completely. Currently, 12 states have laws that either ban payday loans or have strict lending laws which make them unprofitable in the state.
The Many Faces of a Marketing Team
Who are the people behind marketing campaigns and how do they collaborate? In the fast-paced world of digital marketing, keeping everyone on the same page is no mean task. By understanding how marketers coordinate & collaborate, teams can stay in sync and work better, together. Take a look at this infographic from Brightpod to see the many faces of a marketing team! It provides a fun take on the different types of marketers, their favorite tools, what they read and how they collaborate.
The Road to The Wedding
If you are thinking about getting married or would just like to know what the road to wedding looks like, this infographic will definitely come to the rescue. It takes a look at different factors when it comes to making your way through dating scene into wedding. For example – Did you know that you are twice likely to find a date through friends and family than at a bar? What about the fact that 63% of married couples met through friends?
The Evolution of Video Games
Simple video games have been around since 1947, but they have come a long way since then. This infographic presented by National Geographic takes a look at the evolution of video games. Check it out below to learn more.
50 Unbelievable Facts About Earth
You may have lived on Earth all your life, but how much do you really know about it? Did you know that Earth is the only planet in the Solar System with plate tectonics, or that the continents move 2cm every year? For more fascinating facts check out this infographic by Giraffe Childcare.
Partners


Browse Archives By Category
Animated Infographics
Business Infographics
Career & Jobs Infographics
Education Infographics
Entertainment Industry Infographics
Environmental Infographics
Finance & Money Infographics
Food & Drink Infographics
Health Infographics
Historical Infographics
Home & Garden Infographics
Internet Infographics
Law and Legal Infographics
Lifestyle Infographics
Marketing Infographics
Offbeat Infographics
Parenting Infographics
Pets & Animals Infographics
Political Infographics
Shopping Infographics
Sports and Athletic Infographics
Technology Infographics
Transportation Infographics
Travel Infographics
Video Infographics