


Search 12,100+ Infographics!
Are You Suffering a Virus Infection? Computer Repair Tips and More
Computer viruses are the boogeymen of a technological world. They stealthily spread from machine to machine, wreaking sly devastation and costing the world billions of dollars in damage each year. If you think you may be at risk, check out this infographic to learn more about computer viruses and how to avoid them.
Create an Energy Efficient Home with a Deep Energy Retrofit
Making a home more comfortable can start with reassessing the energy that it uses. When thinking about giving your home an energy overhaul isn’t just about reducing your environmental footprint – it’s also about achieving a better quality of life. A deep energy retrofit is a holistic approach to making your home healthier and more comfortable.
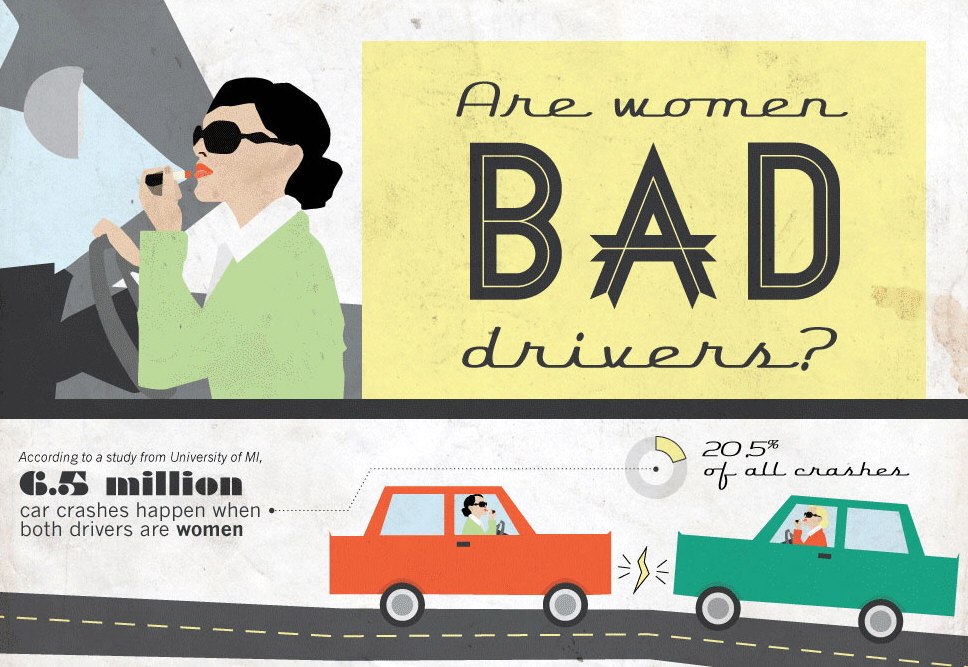
Are Women Bad Drivers?
For years men (and even some women) have claimed that women are inherently bad drivers, but is this really true? This infographic takes a look at the numbers behind men and women and who is more responsible for car crashes and dangerous driving. Check it out below to learn more.
Electricity Usage in Ancient Civilizations
Have you ever wondered about the origins of electricity? Well, you’re in luck. In the infographic below, Powerwerx takes you on a journey from the first crude battery ever found in Mesopotamia to how Egyptians used a certain electric catfish from the Nile River.
The Crime Fighters
Criminal Justice Degree Hub decided to profile some of America’s most famous justice seekers and crime fighters of the past century. This brave group made the biggest splash in the public consciousness. Find out who nailed their perps, and who let them slip through their fingers. Whatever the outcome of their most famous cases, they possessed persistence, guts and style, as well as a flair for staying in the public eye and became as famous as the criminals they were chasing.

20 Of The Greatest Supercars From The Last 20 Years
The motor industry has come in leaps and bounds over the last twenty years. New technologies have allowed for bigger, better and faster supercars. We’ve seen ferocious Ferraris and beautiful Bugatti’s, but which was the best? In order to help you decide, Romans International has assembled the 20 greatest supercars from the last 20 years. Which is your favorite?

The Evolution of TV Sitcoms
Sitcoms are 30-minute funny TV shows. Have you ever thought of how old this genre is? It’s actually older then the television, and the pioneers of sitcoms started yet with a radio. See how they have been coming through decades in this infographic by Custom Writing.
Future of Mobile Data
With the rise of smartphones, consumers are increasingly hungry for data-intensive apps and services. How powerful is this shift, and how will mobile providers cope with these new devices and usage habits? Vistapointe Inc has created this infographic to highlight some of the alarming trends in mobile data and put them into perspective. Sometimes, large numbers are best expressed visually to provide a sense of scale.
The Most Expensive Legal Battles In History
From litigation to divorce, legal battles in court can cost a lot. Many cases drag on for years without positive results. This infographic looks at which cases have been the most costly.

51 Oddball Ways To Use Credit Cards…Without Spending Money
Options Credit was sitting around wondering how many ways people could use their credit cards after their debts were paid off. So they started blurting out ideas and ended up with this “visual” list of 51 ways to use a credit card after your debts are paid off.
Are You Suffering a Virus Infection? Computer Repair Tips and More
Computer viruses are the boogeymen of a technological world. They stealthily spread from machine to machine, wreaking sly devastation and costing the world billions of dollars in damage each year. If you think you may be at risk, check out this infographic to learn more about computer viruses and how to avoid them.
Create an Energy Efficient Home with a Deep Energy Retrofit
Making a home more comfortable can start with reassessing the energy that it uses. When thinking about giving your home an energy overhaul isn’t just about reducing your environmental footprint – it’s also about achieving a better quality of life. A deep energy retrofit is a holistic approach to making your home healthier and more comfortable.
Are Women Bad Drivers?
For years men (and even some women) have claimed that women are inherently bad drivers, but is this really true? This infographic takes a look at the numbers behind men and women and who is more responsible for car crashes and dangerous driving. Check it out below to learn more.
Electricity Usage in Ancient Civilizations
Have you ever wondered about the origins of electricity? Well, you’re in luck. In the infographic below, Powerwerx takes you on a journey from the first crude battery ever found in Mesopotamia to how Egyptians used a certain electric catfish from the Nile River.
The Crime Fighters
Criminal Justice Degree Hub decided to profile some of America’s most famous justice seekers and crime fighters of the past century. This brave group made the biggest splash in the public consciousness. Find out who nailed their perps, and who let them slip through their fingers. Whatever the outcome of their most famous cases, they possessed persistence, guts and style, as well as a flair for staying in the public eye and became as famous as the criminals they were chasing.
20 Of The Greatest Supercars From The Last 20 Years
The motor industry has come in leaps and bounds over the last twenty years. New technologies have allowed for bigger, better and faster supercars. We’ve seen ferocious Ferraris and beautiful Bugatti’s, but which was the best? In order to help you decide, Romans International has assembled the 20 greatest supercars from the last 20 years. Which is your favorite?
The Evolution of TV Sitcoms
Sitcoms are 30-minute funny TV shows. Have you ever thought of how old this genre is? It’s actually older then the television, and the pioneers of sitcoms started yet with a radio. See how they have been coming through decades in this infographic by Custom Writing.
Future of Mobile Data
With the rise of smartphones, consumers are increasingly hungry for data-intensive apps and services. How powerful is this shift, and how will mobile providers cope with these new devices and usage habits? Vistapointe Inc has created this infographic to highlight some of the alarming trends in mobile data and put them into perspective. Sometimes, large numbers are best expressed visually to provide a sense of scale.
The Most Expensive Legal Battles In History
From litigation to divorce, legal battles in court can cost a lot. Many cases drag on for years without positive results. This infographic looks at which cases have been the most costly.
51 Oddball Ways To Use Credit Cards…Without Spending Money
Options Credit was sitting around wondering how many ways people could use their credit cards after their debts were paid off. So they started blurting out ideas and ended up with this “visual” list of 51 ways to use a credit card after your debts are paid off.
Partners


Browse Archives By Category
Animated Infographics
Business Infographics
Career & Jobs Infographics
Education Infographics
Entertainment Industry Infographics
Environmental Infographics
Finance & Money Infographics
Food & Drink Infographics
Health Infographics
Historical Infographics
Home & Garden Infographics
Internet Infographics
Law and Legal Infographics
Lifestyle Infographics
Marketing Infographics
Offbeat Infographics
Parenting Infographics
Pets & Animals Infographics
Political Infographics
Shopping Infographics
Sports and Athletic Infographics
Technology Infographics
Transportation Infographics
Travel Infographics
Video Infographics