


Search 12,100+ Infographics!
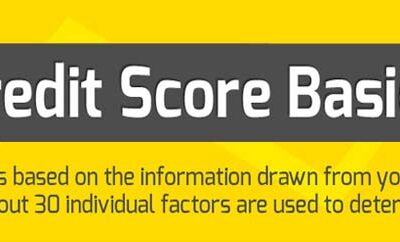
Credit Score Basics
Credit score is one of the most important factors when applying for a mortgage loan. Basically, the credit score is a number between 350 and 850, calculated using a complex mathematical model composed of several indicators taken from the borrower’s credit history, outstanding debts, etc. Higher credit scores represent borrowers with less risk.
Five Things the Government Has Done Right
The idea that the American government can’t do anything right has become pervasive. However, sometimes they can get things right and actually improve our lives. Check out the infographic below to learn about five things the government has actually done right.
Memorable Moments at the Masters
Four of the most recognizable golfers of all time have left their mark on the Masters tournament over the pas seven decades. Check out this infographic from TicketCity which highlights some of the most notable moments of the past and keep your eyes on the 2013 Masters as the best may be yet to come.
A Career in Phlebotomy
This infographic from Phlebotomy Training Group provides an overview of what a career in phlebotomy would entail. Phlebotomy is a great way to enter the medical field. It takes only 2 to 4 months to finish the basic training and the training cost is minimal. The demand for phlebotomists is rising and it is one of the highest paid entry-level health care jobs. The main duty of a phlebotomist is to obtain blood samples for the purpose of laboratory testing.
Chronic Inflammation: America’s Silent Killer
Many diseases once associated with aging, are now being linked to chronic inflammation (CI). CI weakens the body and immune system and is the leading cause of many diseases within the United States. Check out the infographic below presented by best-rn-to-bsn.com to learn more about CI.
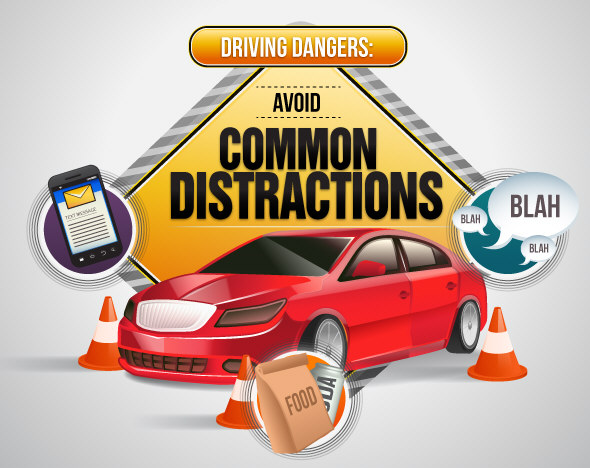
Beyond Texting: Avoid All Distractions While Driving
Driving distracted–even for a moment–can lead to a catastrophe. While texting is one thing that can take your eyes off the road, it’s not the only way drivers can become sidetracked. Eating, interacting with passengers, adjusting the radio and of course, engaging in multimedia interactions can all contribute to a less-than-focused driver…and that can be a very dangerous situation. Check out the infographic below by Allstate and consider taking the proper steps to reduce or eliminate these situations, and avoid common driving distractions.

The Evolution of Distance Learning
Distance learning is a teaching method that instructs and delivers learning material to students via remote correspondence. Throughout the course of human history, education was first a social privilege of the wealthy and elite.
A Brief History of Advertising
This infographic from Ocean Media highlights several key events in history that help define advertising, and lead it to where it is today. Several different countries are represented as they developed new methods to get information across to their audiences and helped pave the way for more development in the advertising, and promotional realm. Also featured is the future, and what the possibilities are for the next generation of advertising.
Everything You Need To Know About Beer
Aall In Limo has created this infographic that shares some fun and interesting facts as well as history regarding one of the world’s all-time favorite beverages – Beer.
Star Safari: Spotting Celebs with Social Media
It’s common to be on the lookout for celebrities in the concrete jungles of New York and L.A. but you can hunt for famous “game” in less common “habitats” using social media as your guide. If you’ve got some social media savvy and a little bit of luck, you might just bag some face time with your favorite superstar, without resorting to creepy stalking. ForRent.com explores this further in the following infographic.
Credit Score Basics
Credit score is one of the most important factors when applying for a mortgage loan. Basically, the credit score is a number between 350 and 850, calculated using a complex mathematical model composed of several indicators taken from the borrower’s credit history, outstanding debts, etc. Higher credit scores represent borrowers with less risk.
Five Things the Government Has Done Right
The idea that the American government can’t do anything right has become pervasive. However, sometimes they can get things right and actually improve our lives. Check out the infographic below to learn about five things the government has actually done right.
Memorable Moments at the Masters
Four of the most recognizable golfers of all time have left their mark on the Masters tournament over the pas seven decades. Check out this infographic from TicketCity which highlights some of the most notable moments of the past and keep your eyes on the 2013 Masters as the best may be yet to come.
A Career in Phlebotomy
This infographic from Phlebotomy Training Group provides an overview of what a career in phlebotomy would entail. Phlebotomy is a great way to enter the medical field. It takes only 2 to 4 months to finish the basic training and the training cost is minimal. The demand for phlebotomists is rising and it is one of the highest paid entry-level health care jobs. The main duty of a phlebotomist is to obtain blood samples for the purpose of laboratory testing.
Chronic Inflammation: America’s Silent Killer
Many diseases once associated with aging, are now being linked to chronic inflammation (CI). CI weakens the body and immune system and is the leading cause of many diseases within the United States. Check out the infographic below presented by best-rn-to-bsn.com to learn more about CI.
Beyond Texting: Avoid All Distractions While Driving
Driving distracted–even for a moment–can lead to a catastrophe. While texting is one thing that can take your eyes off the road, it’s not the only way drivers can become sidetracked. Eating, interacting with passengers, adjusting the radio and of course, engaging in multimedia interactions can all contribute to a less-than-focused driver…and that can be a very dangerous situation. Check out the infographic below by Allstate and consider taking the proper steps to reduce or eliminate these situations, and avoid common driving distractions.
The Evolution of Distance Learning
Distance learning is a teaching method that instructs and delivers learning material to students via remote correspondence. Throughout the course of human history, education was first a social privilege of the wealthy and elite.
A Brief History of Advertising
This infographic from Ocean Media highlights several key events in history that help define advertising, and lead it to where it is today. Several different countries are represented as they developed new methods to get information across to their audiences and helped pave the way for more development in the advertising, and promotional realm. Also featured is the future, and what the possibilities are for the next generation of advertising.
Everything You Need To Know About Beer
Aall In Limo has created this infographic that shares some fun and interesting facts as well as history regarding one of the world’s all-time favorite beverages – Beer.
Star Safari: Spotting Celebs with Social Media
It’s common to be on the lookout for celebrities in the concrete jungles of New York and L.A. but you can hunt for famous “game” in less common “habitats” using social media as your guide. If you’ve got some social media savvy and a little bit of luck, you might just bag some face time with your favorite superstar, without resorting to creepy stalking. ForRent.com explores this further in the following infographic.
Partners


Browse Archives By Category
Animated Infographics
Business Infographics
Career & Jobs Infographics
Education Infographics
Entertainment Industry Infographics
Environmental Infographics
Finance & Money Infographics
Food & Drink Infographics
Health Infographics
Historical Infographics
Home & Garden Infographics
Internet Infographics
Law and Legal Infographics
Lifestyle Infographics
Marketing Infographics
Offbeat Infographics
Parenting Infographics
Pets & Animals Infographics
Political Infographics
Shopping Infographics
Sports and Athletic Infographics
Technology Infographics
Transportation Infographics
Travel Infographics
Video Infographics