


Search 12,100+ Infographics!
Warning Signs of a Catfish Online
The Internet and social media has allowed people to connect in new and easier ways. But how do you know if the person on the other end is who they say they are? In the online world, a “Catfish” is someone who pretends to be someone they are not by creating a false identity on Facebook or other sites. Notre Dame football player Manti Te’o notoriously fell for a fake girlfriend hoax.
From Wolf to Wag: The Evolution of The Dog
How did the majestic grey wolf transform into the Pug? If all dogs descended from wolves, why do dogs have different shaped skulls to wolves? This infographic from Invisible Fence explains how – along with the functions different breeds originally served, and ownership data from the last century.

10 Tips to Improve Your Credit Score
Are you applying for a credit card or mortgage? Is your credit score holding you back? Check out these top tips and see if they can increase your chances of being approved.

7 Record Breaking Elevators Of The Modern World
The following infographic provides a summary of the record breaking elevators of the modern world including interesting facts and figures on each of these engineering feats.

Why EV SSL Certificates Are Essential for eCommerce Business
Are you managing an online web store? Consumers are now shopping online more than ever. In this infographic by SSL Store, learn how consumers decide who to trust before entering their credit card details and why EV SSL certificates are a must for online business.

Top Five Presentation Do’s & Don’ts
Attention all presentation experts – ProPoint Graphics has put together the top presentation tips for planning and delivering an effective presentation. Here are the top 5 do’s and don’ts to remember the next time you are presenting.
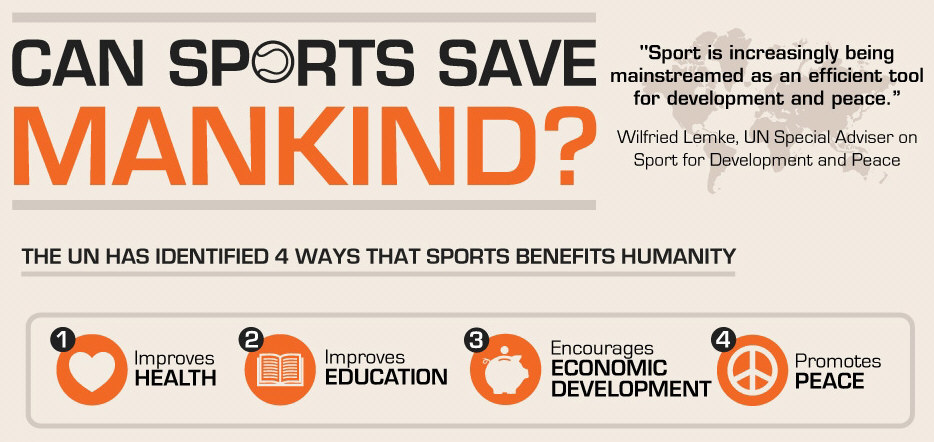
Can Sports Save Mankind?
The UN believes sports can benefit humanity in various ways. They not only improve our health but can also act as an educational tool. Many countries have seen the economic benefit from holding sporting events as this creates jobs within the industry. Take a look at the benefit of sports in the following infographic.

What is a Structured Settlement
To clear up the confusion, My Structured Settlement has created this infographic to help folks better understand what structured settlements are, how to sell them, as well as some other interesting information about these.
State of the Music Licensing Industry – 2013
Here is an infographic report providing detailed analysis of the current state of the Music Licensing Industry. The report provides insightful data on the global multi-billion dollar music licensing industry, and highlights the prolific use of retitling amongst music licensing companies, as well as the size of the industry and current trends and roles within music licensing.
How LinkedIn Is Revolutionizing The World of Recruiting
LinkedIn is the social media enigma, the one social media site that seems to have a profoundly stronger impact on companies than it does on its users. For people looking for jobs, LinkedIn is still just one part of a very difficult process. But for recruiters? It’s a gold mine. It is changing the world of recruiting, and the metamorphosis is just beginning.
Warning Signs of a Catfish Online
The Internet and social media has allowed people to connect in new and easier ways. But how do you know if the person on the other end is who they say they are? In the online world, a “Catfish” is someone who pretends to be someone they are not by creating a false identity on Facebook or other sites. Notre Dame football player Manti Te’o notoriously fell for a fake girlfriend hoax.
From Wolf to Wag: The Evolution of The Dog
How did the majestic grey wolf transform into the Pug? If all dogs descended from wolves, why do dogs have different shaped skulls to wolves? This infographic from Invisible Fence explains how – along with the functions different breeds originally served, and ownership data from the last century.
10 Tips to Improve Your Credit Score
Are you applying for a credit card or mortgage? Is your credit score holding you back? Check out these top tips and see if they can increase your chances of being approved.
7 Record Breaking Elevators Of The Modern World
The following infographic provides a summary of the record breaking elevators of the modern world including interesting facts and figures on each of these engineering feats.
Why EV SSL Certificates Are Essential for eCommerce Business
Are you managing an online web store? Consumers are now shopping online more than ever. In this infographic by SSL Store, learn how consumers decide who to trust before entering their credit card details and why EV SSL certificates are a must for online business.
Top Five Presentation Do’s & Don’ts
Attention all presentation experts – ProPoint Graphics has put together the top presentation tips for planning and delivering an effective presentation. Here are the top 5 do’s and don’ts to remember the next time you are presenting.
Can Sports Save Mankind?
The UN believes sports can benefit humanity in various ways. They not only improve our health but can also act as an educational tool. Many countries have seen the economic benefit from holding sporting events as this creates jobs within the industry. Take a look at the benefit of sports in the following infographic.
What is a Structured Settlement
To clear up the confusion, My Structured Settlement has created this infographic to help folks better understand what structured settlements are, how to sell them, as well as some other interesting information about these.
State of the Music Licensing Industry – 2013
Here is an infographic report providing detailed analysis of the current state of the Music Licensing Industry. The report provides insightful data on the global multi-billion dollar music licensing industry, and highlights the prolific use of retitling amongst music licensing companies, as well as the size of the industry and current trends and roles within music licensing.
How LinkedIn Is Revolutionizing The World of Recruiting
LinkedIn is the social media enigma, the one social media site that seems to have a profoundly stronger impact on companies than it does on its users. For people looking for jobs, LinkedIn is still just one part of a very difficult process. But for recruiters? It’s a gold mine. It is changing the world of recruiting, and the metamorphosis is just beginning.
Partners


Browse Archives By Category
Animated Infographics
Business Infographics
Career & Jobs Infographics
Education Infographics
Entertainment Industry Infographics
Environmental Infographics
Finance & Money Infographics
Food & Drink Infographics
Health Infographics
Historical Infographics
Home & Garden Infographics
Internet Infographics
Law and Legal Infographics
Lifestyle Infographics
Marketing Infographics
Offbeat Infographics
Parenting Infographics
Pets & Animals Infographics
Political Infographics
Shopping Infographics
Sports and Athletic Infographics
Technology Infographics
Transportation Infographics
Travel Infographics
Video Infographics