


Search 12,100+ Infographics!
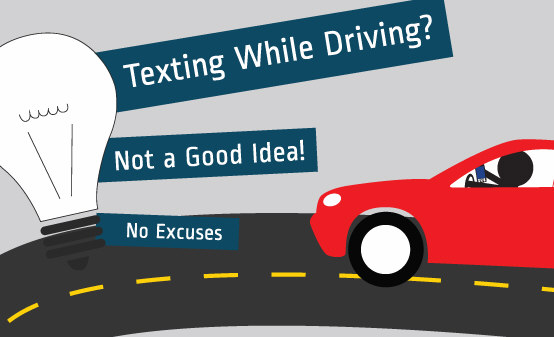
The Dangers of Texting While Driving
This infographic from BGS shows the dangers there are with texting and driving. Texting while driving has become more dangerous than drinking and driving yet not one is talking about how much more deadly texting while driving is. Hopefully this infographic will help to raise awareness of this important issue and get people to think twice about texting the next time they are behind the wheel.
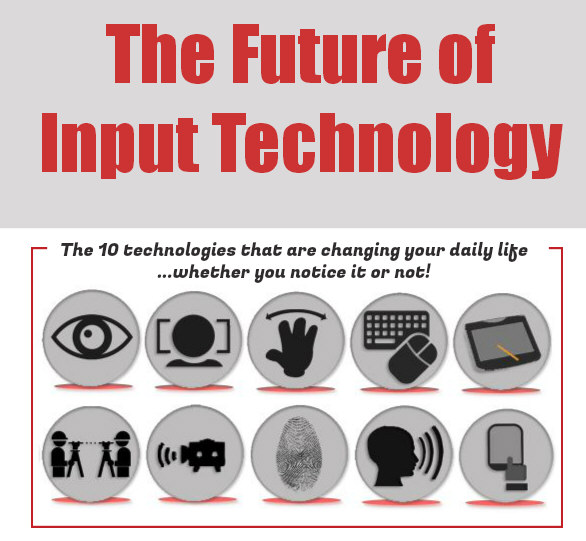
The Future of Input Technology
In order for technology to meet the ever-changing needs of the end-user, it’s important to know what technology is available, how it’s evolving and where it can be best put to use to ensure that user experiences are continuously improved. This infographic from andersDX shows how technology is currently changing our lives (whether we know it or not) and what we can expect to see introducing to daily life in the near future.

The Business Of Healthcare
Healthcare costs are spiraling out of control, but where does this unprecedented amount of spending go? In this infographic from Best Healthcare MBA, see how your healthcare dollars are spent and take a look at the profits of some key players behind the healthcare scene.
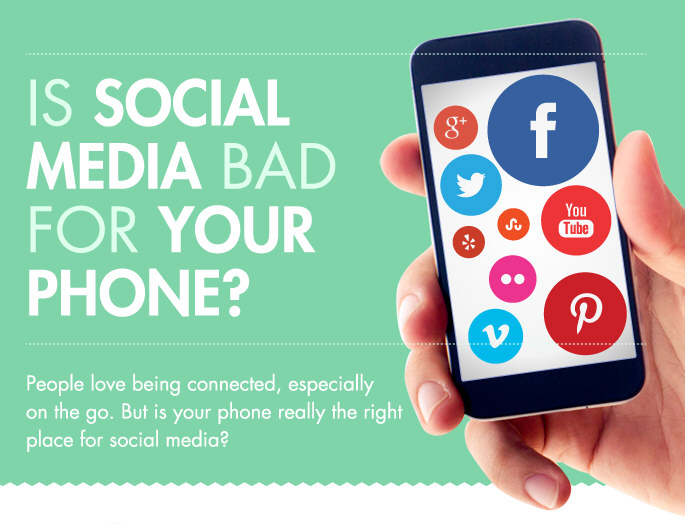
Is Social Media Bad For Your Phone
The vast majority of us use social media such as Facebook, Twitter and Pinterest on a daily, and in many cases, hourly basis. However, few stop to think about the negative impacts that this social media usage has on both our phones and our lives. liGo takes a look at some of the most interesting statistics surrounding social media and mobile phone usage in the following infographic.
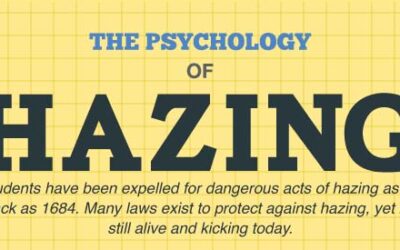
The Psychology of Hazing
Hazing has been around for many years, and even though there are laws to protect people from hazing it still exists, and will continue to exist for a while. This infographic presented by BestSchoolCounselingDegrees.com takes a deeper look at the psychology behind hazing. Check it out below to learn more.
St. Patrick’s Day Parade of Facts
Every March 17, millions of people around the globe don the green and turn Irish. They might march in parades, wear shamrocks, gather in pubs or simply get rowdy in honor of St. Patrick, who died on that day in the year 461. Who is this figure anyway? St. Patrick is known for introduced Christianity to Ireland in the fifth century. Today, St. Patrick stands as a beloved figure in Ireland and as one of the world’s most popular saints.
The Lottery’s Biggest Winning Losers
Check out some of the most surprising facts about a few of the biggest lottery winners in history in this infographic from Casino.org. You just might want to reconsider once you see how some of the lottery’s biggest winners blew their fortune (or misfortune).
Fountain of Youth: 22 Ways To Live Longer
Since the beginning of time, man has searched far and wide for the fountain of youth. And while such a thing may not exist, science is honing in on the keys to slowing the aging process. If you plan to stay forever young, follow these 22 unusual tips from the folks at Confused.com to help maintain your vitality and vigor.
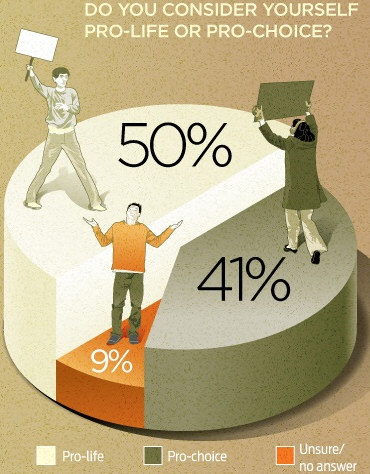
What We Think About Abortion
While a slim majority of Americans believe abortion should be legal in most cases, even a brief close-up examination of public opinion reveals a complicated and nuanced picture that exposes both political differences and semantic ones. Learn more in the folowing infographic by www.healthcare-administration-degree.net.
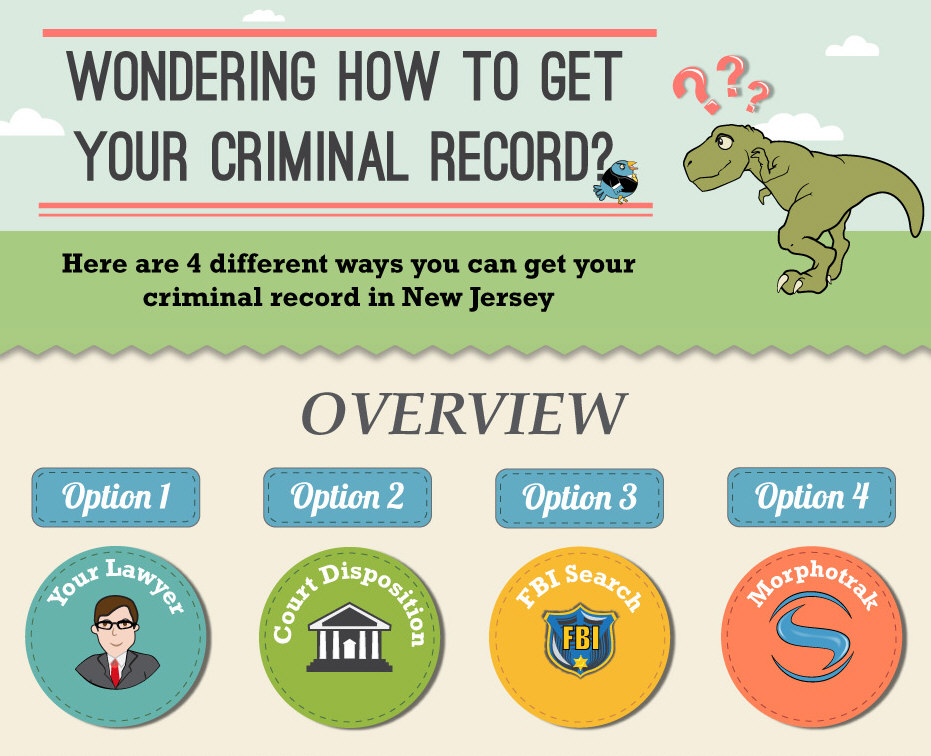
How to Get Your Criminal Record
There are several reasons you may want to get your criminal record. First is for job purposes; that is to see what your employers can find on you. The second is to begin the process of cleaning your record or applying for an expungement. Lastly, you may want to request your record after an expungement, to make sure it no longer exists.
The Dangers of Texting While Driving
This infographic from BGS shows the dangers there are with texting and driving. Texting while driving has become more dangerous than drinking and driving yet not one is talking about how much more deadly texting while driving is. Hopefully this infographic will help to raise awareness of this important issue and get people to think twice about texting the next time they are behind the wheel.
The Future of Input Technology
In order for technology to meet the ever-changing needs of the end-user, it’s important to know what technology is available, how it’s evolving and where it can be best put to use to ensure that user experiences are continuously improved. This infographic from andersDX shows how technology is currently changing our lives (whether we know it or not) and what we can expect to see introducing to daily life in the near future.
The Business Of Healthcare
Healthcare costs are spiraling out of control, but where does this unprecedented amount of spending go? In this infographic from Best Healthcare MBA, see how your healthcare dollars are spent and take a look at the profits of some key players behind the healthcare scene.
Is Social Media Bad For Your Phone
The vast majority of us use social media such as Facebook, Twitter and Pinterest on a daily, and in many cases, hourly basis. However, few stop to think about the negative impacts that this social media usage has on both our phones and our lives. liGo takes a look at some of the most interesting statistics surrounding social media and mobile phone usage in the following infographic.
The Psychology of Hazing
Hazing has been around for many years, and even though there are laws to protect people from hazing it still exists, and will continue to exist for a while. This infographic presented by BestSchoolCounselingDegrees.com takes a deeper look at the psychology behind hazing. Check it out below to learn more.
St. Patrick’s Day Parade of Facts
Every March 17, millions of people around the globe don the green and turn Irish. They might march in parades, wear shamrocks, gather in pubs or simply get rowdy in honor of St. Patrick, who died on that day in the year 461. Who is this figure anyway? St. Patrick is known for introduced Christianity to Ireland in the fifth century. Today, St. Patrick stands as a beloved figure in Ireland and as one of the world’s most popular saints.
The Lottery’s Biggest Winning Losers
Check out some of the most surprising facts about a few of the biggest lottery winners in history in this infographic from Casino.org. You just might want to reconsider once you see how some of the lottery’s biggest winners blew their fortune (or misfortune).
Fountain of Youth: 22 Ways To Live Longer
Since the beginning of time, man has searched far and wide for the fountain of youth. And while such a thing may not exist, science is honing in on the keys to slowing the aging process. If you plan to stay forever young, follow these 22 unusual tips from the folks at Confused.com to help maintain your vitality and vigor.
What We Think About Abortion
While a slim majority of Americans believe abortion should be legal in most cases, even a brief close-up examination of public opinion reveals a complicated and nuanced picture that exposes both political differences and semantic ones. Learn more in the folowing infographic by www.healthcare-administration-degree.net.
How to Get Your Criminal Record
There are several reasons you may want to get your criminal record. First is for job purposes; that is to see what your employers can find on you. The second is to begin the process of cleaning your record or applying for an expungement. Lastly, you may want to request your record after an expungement, to make sure it no longer exists.
Partners


Browse Archives By Category
Animated Infographics
Business Infographics
Career & Jobs Infographics
Education Infographics
Entertainment Industry Infographics
Environmental Infographics
Finance & Money Infographics
Food & Drink Infographics
Health Infographics
Historical Infographics
Home & Garden Infographics
Internet Infographics
Law and Legal Infographics
Lifestyle Infographics
Marketing Infographics
Offbeat Infographics
Parenting Infographics
Pets & Animals Infographics
Political Infographics
Shopping Infographics
Sports and Athletic Infographics
Technology Infographics
Transportation Infographics
Travel Infographics
Video Infographics