


Search 12,100+ Infographics!
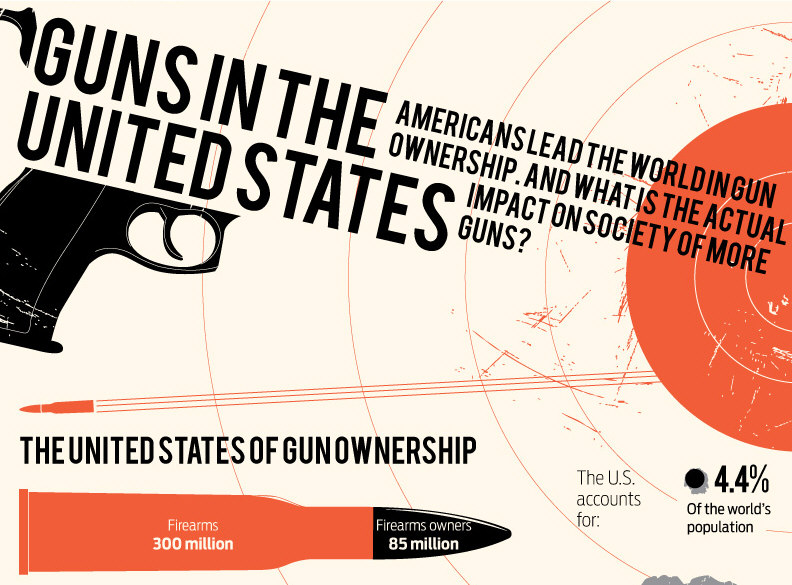
Guns in America: The Impact of Guns on Society
If you have watched any major news station within the past six months you are well aware that firearms and the safety of firearms are a hot topic in the United States. The United States leads the world in guns, owning forty-six percent of them. So what impact do all of these guns have on the society of the United States? According to the infographic below, guns have a large impact on the society. In 2009 more than 30,000 people died from guns; 554 were an accident, 18,735 were suicides, and 11,493 were homicides. The gun related homicides made up sixty-eight percent of all homicides in 2009.

Make Way For The Agency of the Future
The digital revolution has transformed marketing. With the changing buyer, budget pressures, new social channels, and content, marketers have to do more with less. And marketing automation has become the new must-have technology to help marketers increase their reach. Now marketers can nurture leads until they are ready to buy, send only the hottest leads to sales, and deliver results to the executive team.

38 Benefits of Owning A Dog
It’s a pretty well known fact that owning a dog (as well as other pets) can greatly improve our lives. TheDogTrainingSecret.com has taken a moment and compiled a list of all the reasons they feel it’s beneficial to own a dog. Happiness, health, and longevity are just a few of the benefits.

UK Road Safety
Town Centre Car Parks are becoming concerned about the number of incidents that occur in the UK, especially when it turns out that many of them could be prevented. They’ve teamed up with the Department for Transport’s well known Think! campaign to produce this road safety infographic all about shocking road incident statistics up and down the country and giving you advice on how to prevent them and stay safe.

A Brief History of Samsung Mobile Phones
Today Samsung is one of the largest mobile phone manufacturers, but it was a long process for them to get there. This infographic visualizes the past 10 years and displays some cool statistics about the phones produced back then in regard to the ones from today.
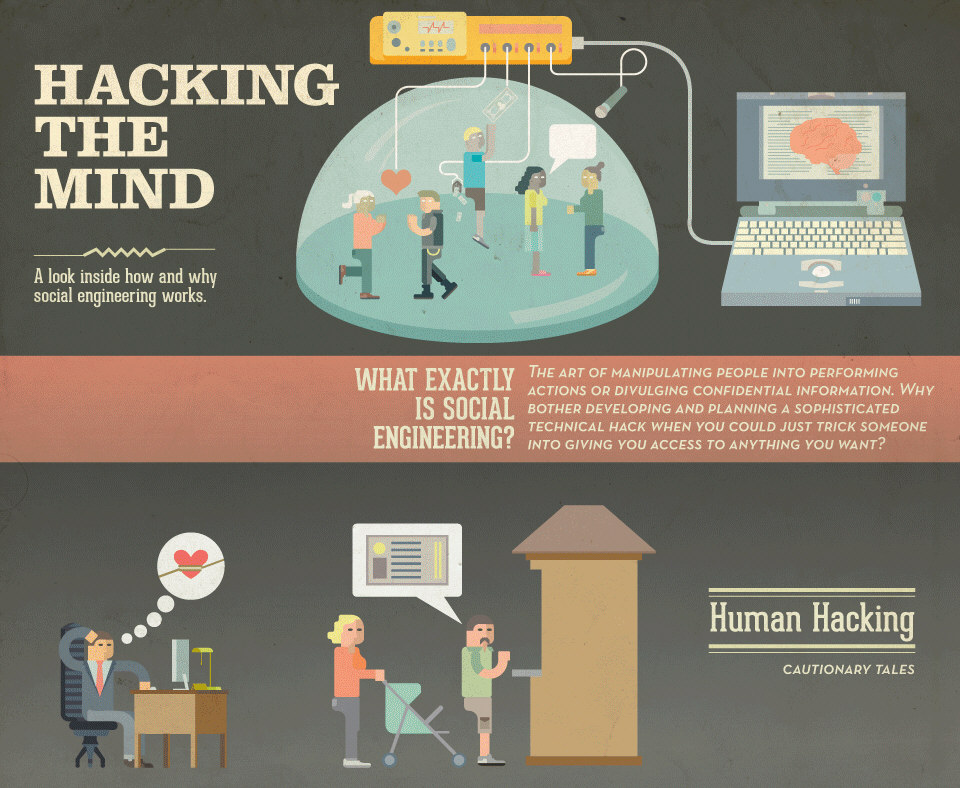
Hacking the Mind
Certain forms of hacking require much more than knowing html code or how to infiltrate firewalls. For social engineers (also referred to as mind hackers), manipulation is a well honed skill that is essential for completing a job. These hackers use their knowledge of individuals to manipulate them into giving out personal information. For more information on social engineering and the popular techniques used, check out this infographic from Veracode Application Security.
A History of Crufts
Crufts is now the largest dog show in the world. But how did it all begin? This infographic has some of the facts and figures about this amazing show.
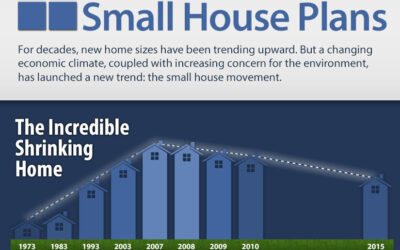
The Rise of Small House Plans
This infographic by Houseplans.co explores the small house plan movement trending in the United States. Find out what’s fueling this trend and what to expect from home plan designs in the future.

There’s a Saint For That
For those with a very specific spiritual need, a simple prayer to God may not be enough. At least that is the opinion of this infographic from Online Christian Colleges. The infographic suggests that sometimes it’s helpful to appeal directly to a patron saint. Whether you’re a craft-beer producer, a nervous bride or just have a toothache, chances are Christian-Catholic tradition has recognized someone who may be willing to take up your cause.
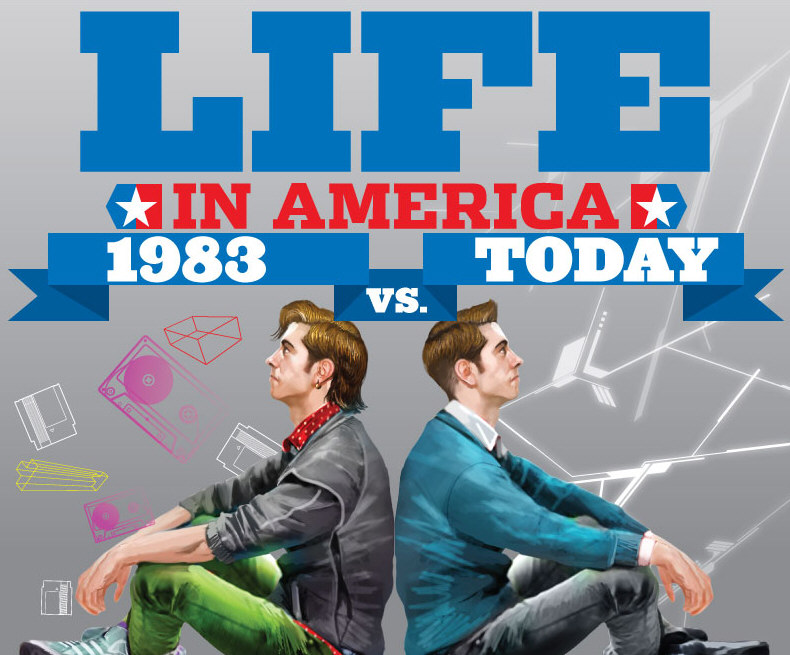
Life in America: 1983 vs. Today
Things were quite a bit different in America in the 1980s compared to today. This infographic from Top Degrees Online takes a looks at some of these differences and what has changed.
Guns in America: The Impact of Guns on Society
If you have watched any major news station within the past six months you are well aware that firearms and the safety of firearms are a hot topic in the United States. The United States leads the world in guns, owning forty-six percent of them. So what impact do all of these guns have on the society of the United States? According to the infographic below, guns have a large impact on the society. In 2009 more than 30,000 people died from guns; 554 were an accident, 18,735 were suicides, and 11,493 were homicides. The gun related homicides made up sixty-eight percent of all homicides in 2009.
Make Way For The Agency of the Future
The digital revolution has transformed marketing. With the changing buyer, budget pressures, new social channels, and content, marketers have to do more with less. And marketing automation has become the new must-have technology to help marketers increase their reach. Now marketers can nurture leads until they are ready to buy, send only the hottest leads to sales, and deliver results to the executive team.
38 Benefits of Owning A Dog
It’s a pretty well known fact that owning a dog (as well as other pets) can greatly improve our lives. TheDogTrainingSecret.com has taken a moment and compiled a list of all the reasons they feel it’s beneficial to own a dog. Happiness, health, and longevity are just a few of the benefits.
UK Road Safety
Town Centre Car Parks are becoming concerned about the number of incidents that occur in the UK, especially when it turns out that many of them could be prevented. They’ve teamed up with the Department for Transport’s well known Think! campaign to produce this road safety infographic all about shocking road incident statistics up and down the country and giving you advice on how to prevent them and stay safe.
A Brief History of Samsung Mobile Phones
Today Samsung is one of the largest mobile phone manufacturers, but it was a long process for them to get there. This infographic visualizes the past 10 years and displays some cool statistics about the phones produced back then in regard to the ones from today.
Hacking the Mind
Certain forms of hacking require much more than knowing html code or how to infiltrate firewalls. For social engineers (also referred to as mind hackers), manipulation is a well honed skill that is essential for completing a job. These hackers use their knowledge of individuals to manipulate them into giving out personal information. For more information on social engineering and the popular techniques used, check out this infographic from Veracode Application Security.
A History of Crufts
Crufts is now the largest dog show in the world. But how did it all begin? This infographic has some of the facts and figures about this amazing show.
The Rise of Small House Plans
This infographic by Houseplans.co explores the small house plan movement trending in the United States. Find out what’s fueling this trend and what to expect from home plan designs in the future.
There’s a Saint For That
For those with a very specific spiritual need, a simple prayer to God may not be enough. At least that is the opinion of this infographic from Online Christian Colleges. The infographic suggests that sometimes it’s helpful to appeal directly to a patron saint. Whether you’re a craft-beer producer, a nervous bride or just have a toothache, chances are Christian-Catholic tradition has recognized someone who may be willing to take up your cause.
Life in America: 1983 vs. Today
Things were quite a bit different in America in the 1980s compared to today. This infographic from Top Degrees Online takes a looks at some of these differences and what has changed.
Partners


Browse Archives By Category
Animated Infographics
Business Infographics
Career & Jobs Infographics
Education Infographics
Entertainment Industry Infographics
Environmental Infographics
Finance & Money Infographics
Food & Drink Infographics
Health Infographics
Historical Infographics
Home & Garden Infographics
Internet Infographics
Law and Legal Infographics
Lifestyle Infographics
Marketing Infographics
Offbeat Infographics
Parenting Infographics
Pets & Animals Infographics
Political Infographics
Shopping Infographics
Sports and Athletic Infographics
Technology Infographics
Transportation Infographics
Travel Infographics
Video Infographics