


Search 12,100+ Infographics!
Get The Most From Your Music
This infographic traces the transformation of music over the last 100 years, from when we couldn’t even record or reproduce music to the digital age where music is everywhere all the time. It also touches on the resurgence of vinyl, and analog vs. digital.

The Brain: A User’s Guide to Emotions
As neuroscience researchers work to unravel the inner workings of the brain, we know more than ever before about the mysteries of where emotions originate in the brain and the connections between instinct, intelligence and emotion. This work is yielding fascinating insights that we can use to understand how we react to situations and people. The brain, which is a much more flexible organ that previously thought, can be consciously retrained to be more emotionally flexible, understanding and sensitive. The emotional functions of the brain are interwoven at many levels. These maps provide an overview of the major areas of the brain involved in processing emotions.
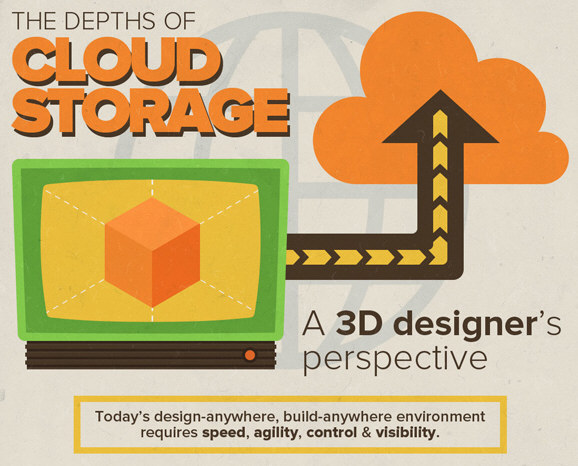
The Depths of Cloud Storage: A 3D Designer’s Perspective
These days, the concept of the cloud is nothing new as everyone is sharing their data on it. However, 3D designers have a different set of rules they must follow in order to keep their creative property secure. 3DVIA has put together an infographic about the cloud as seen through the eyes of a 3D artist.

Not So Grand Auto Thefts
If a consumer with a new auto loan has their car stolen, or gets into an accident, insurance companies will pay for the current market value of the car, but not what a borrower owes a lender. If a driver prepared ahead of time and purchased GAP insurance, that would cover the difference in between the two numbers. Not all consumers have this coverage though and it can make a big impact, especially for those who drive one of the top five stolen vehicles, as revealed below. But fortunately, not every auto heist is well-planned either.
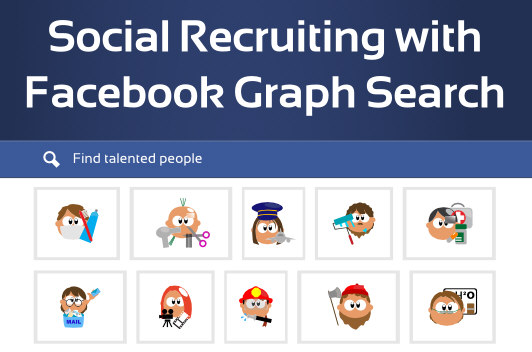
How Recruiters Can Take Advantage of Facebook Graph Search
With a traditional content search, you may have spent time looking for candidates on the surface. But now, with Facebook Graph Search, you can find talented people based on their interests and experiences in a targeted search. This infographic shows you how to get started with Facebook Graph Search in order to find the best employees.
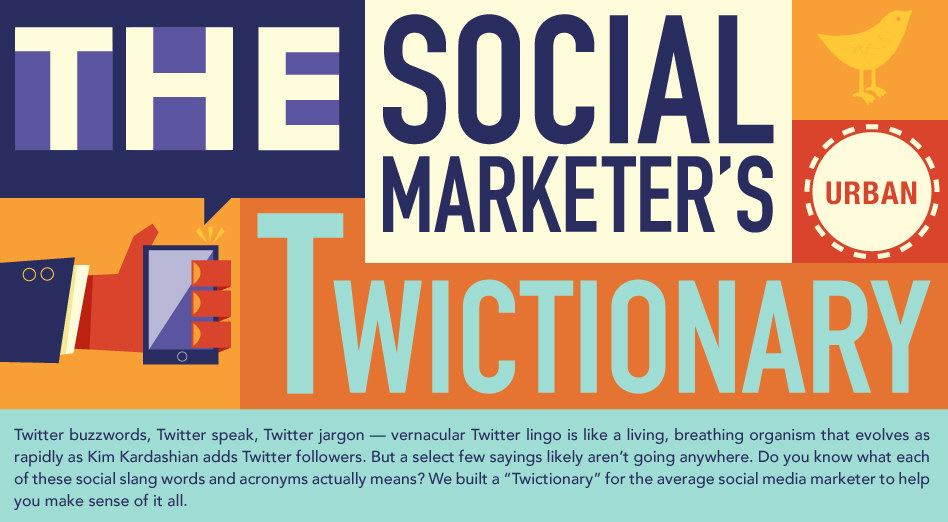
The Social Marketer’s Urban Twictionary
The folks at Marketo thought it would be fun to study a particular group of social media subcultures. Twitter users are increasingly morphing the english language to describe their Twexperiences (hence the lingo).

Famous People Who Served In The Armed Forces
Many writers, actors and singers have proudly served their countries, both in war and in times of peace. While Elvis Presley might be the best known G.I. there are others whose names might surprise you. Check out this infographic and read about other forces favorites.

Can a Mobile App Really Improve Learning?
As mobile devices march toward ubiquity, they’re finding their way into the hands of our earliest learners. Just as parents and educators questioned the quality of children’s television content in its early days, so are they beginning to ask questions about the quality of mobile device content aimed at children.
How to Keep an Eye on Your Dog Using Skype
There are a lot of Skype fans out there who are dog owners. You know the challenges of leaving Fido at home while being away on a business trip or working long hours at the office all day. One of the best hidden tips of using Skype is that you can set up your Skype calls to “auto-answer.” This means Fido doesn’t have to worry about how to click a mouse to answer a Skype call. It’s a great solution for checking in on pets and it’s very easy. The steps are summarized here in this cool infographic.

Why B2B Businesses Should Leverage the Potential of Social Media in 2013
This infographic from Real Business Rescue provides an idea about the immense potential of social media and how B2B marketers are tapping into this potential in their marketing efforts.
Get The Most From Your Music
This infographic traces the transformation of music over the last 100 years, from when we couldn’t even record or reproduce music to the digital age where music is everywhere all the time. It also touches on the resurgence of vinyl, and analog vs. digital.
The Brain: A User’s Guide to Emotions
As neuroscience researchers work to unravel the inner workings of the brain, we know more than ever before about the mysteries of where emotions originate in the brain and the connections between instinct, intelligence and emotion. This work is yielding fascinating insights that we can use to understand how we react to situations and people. The brain, which is a much more flexible organ that previously thought, can be consciously retrained to be more emotionally flexible, understanding and sensitive. The emotional functions of the brain are interwoven at many levels. These maps provide an overview of the major areas of the brain involved in processing emotions.
The Depths of Cloud Storage: A 3D Designer’s Perspective
These days, the concept of the cloud is nothing new as everyone is sharing their data on it. However, 3D designers have a different set of rules they must follow in order to keep their creative property secure. 3DVIA has put together an infographic about the cloud as seen through the eyes of a 3D artist.
Not So Grand Auto Thefts
If a consumer with a new auto loan has their car stolen, or gets into an accident, insurance companies will pay for the current market value of the car, but not what a borrower owes a lender. If a driver prepared ahead of time and purchased GAP insurance, that would cover the difference in between the two numbers. Not all consumers have this coverage though and it can make a big impact, especially for those who drive one of the top five stolen vehicles, as revealed below. But fortunately, not every auto heist is well-planned either.
How Recruiters Can Take Advantage of Facebook Graph Search
With a traditional content search, you may have spent time looking for candidates on the surface. But now, with Facebook Graph Search, you can find talented people based on their interests and experiences in a targeted search. This infographic shows you how to get started with Facebook Graph Search in order to find the best employees.
The Social Marketer’s Urban Twictionary
The folks at Marketo thought it would be fun to study a particular group of social media subcultures. Twitter users are increasingly morphing the english language to describe their Twexperiences (hence the lingo).
Famous People Who Served In The Armed Forces
Many writers, actors and singers have proudly served their countries, both in war and in times of peace. While Elvis Presley might be the best known G.I. there are others whose names might surprise you. Check out this infographic and read about other forces favorites.
Can a Mobile App Really Improve Learning?
As mobile devices march toward ubiquity, they’re finding their way into the hands of our earliest learners. Just as parents and educators questioned the quality of children’s television content in its early days, so are they beginning to ask questions about the quality of mobile device content aimed at children.
How to Keep an Eye on Your Dog Using Skype
There are a lot of Skype fans out there who are dog owners. You know the challenges of leaving Fido at home while being away on a business trip or working long hours at the office all day. One of the best hidden tips of using Skype is that you can set up your Skype calls to “auto-answer.” This means Fido doesn’t have to worry about how to click a mouse to answer a Skype call. It’s a great solution for checking in on pets and it’s very easy. The steps are summarized here in this cool infographic.
Why B2B Businesses Should Leverage the Potential of Social Media in 2013
This infographic from Real Business Rescue provides an idea about the immense potential of social media and how B2B marketers are tapping into this potential in their marketing efforts.
Partners


Browse Archives By Category
Animated Infographics
Business Infographics
Career & Jobs Infographics
Education Infographics
Entertainment Industry Infographics
Environmental Infographics
Finance & Money Infographics
Food & Drink Infographics
Health Infographics
Historical Infographics
Home & Garden Infographics
Internet Infographics
Law and Legal Infographics
Lifestyle Infographics
Marketing Infographics
Offbeat Infographics
Parenting Infographics
Pets & Animals Infographics
Political Infographics
Shopping Infographics
Sports and Athletic Infographics
Technology Infographics
Transportation Infographics
Travel Infographics
Video Infographics