


Search 12,100+ Infographics!
Five Ways Americans are Bullied by the Government
Are we being bullied by the government? From controlling the internet to armed drones, it sure looks like the government might be trying to control us. This infographic takes a look at five ways the government bullies Americans.
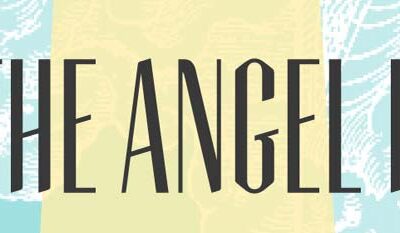
Rise of the Angel Investor
The number of angel Investors and the amount of of dollars they’ve invested have significantly increased over the last ten years, allowing aspiring entrepreneurs more opportunities than ever to achieve success for their early stage companies. This infographic visualizes this significant increase in angel investors and invested dollars in the last decade.
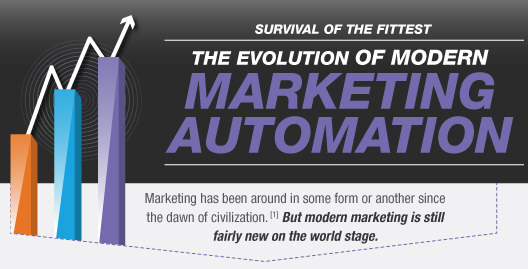
The Evolution of Modern Marketing Automation
This infographic from Marketo provides a visual interpretation of the evolution of modern marketing. Learn how advances in radio, television, the internet, social media, and the arrival of marketing automation technology has paved the way for modern marketing as we know it today.
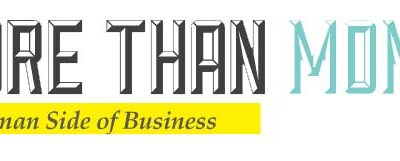
More Than Money: The Human Side of Business
Typically when we think of business we think of money. However, there is a lot more to business than just money. This infographic takes a look at the human side of business which includes employers, environment, and humanity. Check it out below to learn more.
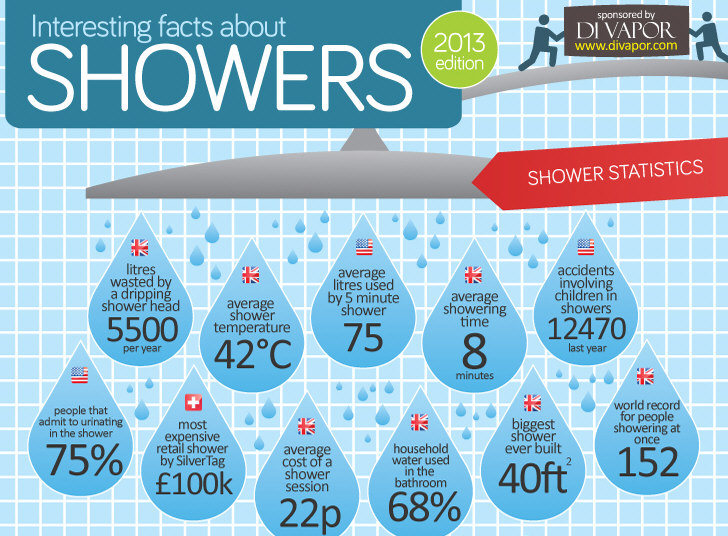
Interesting Facts About Showers
That’s right, according to official statistics; Mexico tops the list of countries that shower the most. Close to 90% of Mexicans shower every single day, compared to approximately 70% of Americans. Does this mean Americans aren’t as hygienic as Mexicans, or does it mean Americans think about the environment more than Mexicans? Second on the list is Australia, followed by France, USA, UK, Russia, Sweden, Germany and then China. Just 25% of Chinese men shower every day.
Celebrating the Battery
Just imagine where the world would be without batteries! Having three grandkids and toys abounding, I always keep an ample supply of these power sources. With the recent “National Battery Day,” Batteries Plus has created an infographic for the event which provides some useful and historical data about batteries.
Earth’s Most Invasive Invaders
We all love b-movies; the horror, the stop-motion animation, the camp… Despite the dark subject matter, in its own way, it’s a warm, fuzzy world where all the bad-guys are bad and the good guys are wholesome, whiter-than-white, ‘Christopher Reeve’s, rather than gritty, conflicted ‘Christian Bale’s. Well, WE all love b-movies, and if YOU don’t, then you’re not one of us, and you will soon be assimilated.
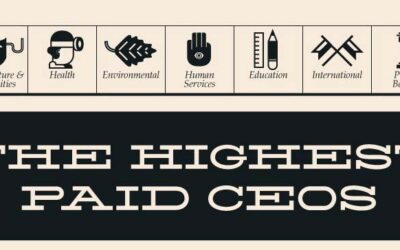
The Highest Paid CEOs in Charity
Charities strive every day to make the world a better place. From animal protection to religion, there seems to be a charity for every cause. This infographic from Best MSW Programs takes a look at the highest paid CEOs in charity.

Presidential Fun Facts
“Fun” and “quirky” aren’t typical terms that come to mind when you think of U.S. presidents’ personal lives, but you might be surprised! As the second infographic in a two-part series on our nation’s great leaders, The following infographic includes some fun facts about our commanders in chief.

The Future of Money
Could we be moving towards a global currency? Only two percent of foreign exchange transactions relate to real world goods and services, meaning that 98 percent are purely speculative transactions. This in turn triggers foreign exchange crises. Check out the following infographic from Money Choice to learn more about the future of money.
Five Ways Americans are Bullied by the Government
Are we being bullied by the government? From controlling the internet to armed drones, it sure looks like the government might be trying to control us. This infographic takes a look at five ways the government bullies Americans.
Rise of the Angel Investor
The number of angel Investors and the amount of of dollars they’ve invested have significantly increased over the last ten years, allowing aspiring entrepreneurs more opportunities than ever to achieve success for their early stage companies. This infographic visualizes this significant increase in angel investors and invested dollars in the last decade.
The Evolution of Modern Marketing Automation
This infographic from Marketo provides a visual interpretation of the evolution of modern marketing. Learn how advances in radio, television, the internet, social media, and the arrival of marketing automation technology has paved the way for modern marketing as we know it today.
More Than Money: The Human Side of Business
Typically when we think of business we think of money. However, there is a lot more to business than just money. This infographic takes a look at the human side of business which includes employers, environment, and humanity. Check it out below to learn more.
Interesting Facts About Showers
That’s right, according to official statistics; Mexico tops the list of countries that shower the most. Close to 90% of Mexicans shower every single day, compared to approximately 70% of Americans. Does this mean Americans aren’t as hygienic as Mexicans, or does it mean Americans think about the environment more than Mexicans? Second on the list is Australia, followed by France, USA, UK, Russia, Sweden, Germany and then China. Just 25% of Chinese men shower every day.
Celebrating the Battery
Just imagine where the world would be without batteries! Having three grandkids and toys abounding, I always keep an ample supply of these power sources. With the recent “National Battery Day,” Batteries Plus has created an infographic for the event which provides some useful and historical data about batteries.
Earth’s Most Invasive Invaders
We all love b-movies; the horror, the stop-motion animation, the camp… Despite the dark subject matter, in its own way, it’s a warm, fuzzy world where all the bad-guys are bad and the good guys are wholesome, whiter-than-white, ‘Christopher Reeve’s, rather than gritty, conflicted ‘Christian Bale’s. Well, WE all love b-movies, and if YOU don’t, then you’re not one of us, and you will soon be assimilated.
The Highest Paid CEOs in Charity
Charities strive every day to make the world a better place. From animal protection to religion, there seems to be a charity for every cause. This infographic from Best MSW Programs takes a look at the highest paid CEOs in charity.
Presidential Fun Facts
“Fun” and “quirky” aren’t typical terms that come to mind when you think of U.S. presidents’ personal lives, but you might be surprised! As the second infographic in a two-part series on our nation’s great leaders, The following infographic includes some fun facts about our commanders in chief.
The Future of Money
Could we be moving towards a global currency? Only two percent of foreign exchange transactions relate to real world goods and services, meaning that 98 percent are purely speculative transactions. This in turn triggers foreign exchange crises. Check out the following infographic from Money Choice to learn more about the future of money.
Partners


Browse Archives By Category
Animated Infographics
Business Infographics
Career & Jobs Infographics
Education Infographics
Entertainment Industry Infographics
Environmental Infographics
Finance & Money Infographics
Food & Drink Infographics
Health Infographics
Historical Infographics
Home & Garden Infographics
Internet Infographics
Law and Legal Infographics
Lifestyle Infographics
Marketing Infographics
Offbeat Infographics
Parenting Infographics
Pets & Animals Infographics
Political Infographics
Shopping Infographics
Sports and Athletic Infographics
Technology Infographics
Transportation Infographics
Travel Infographics
Video Infographics