


Search 12,100+ Infographics!
How Twitter Saw The Oscars 2013
Nothing sparks a Twitter storm like well-dressed A-listers at an awards ceremony. Of course staying up for the Oscars for those in the UK takes a whole lot of commitment, that’s why Silverbean took the easy route and turned to Twitter. Here is their handy guide to what you missed online and IRL.

And the Oscar For the Furthest Traveled Goes To…
The following infographic from Insure&Away Travel Insurance shows information about how far the Oscar nominees had to travel to get to the 2013 Oscars. The results may surprise you.
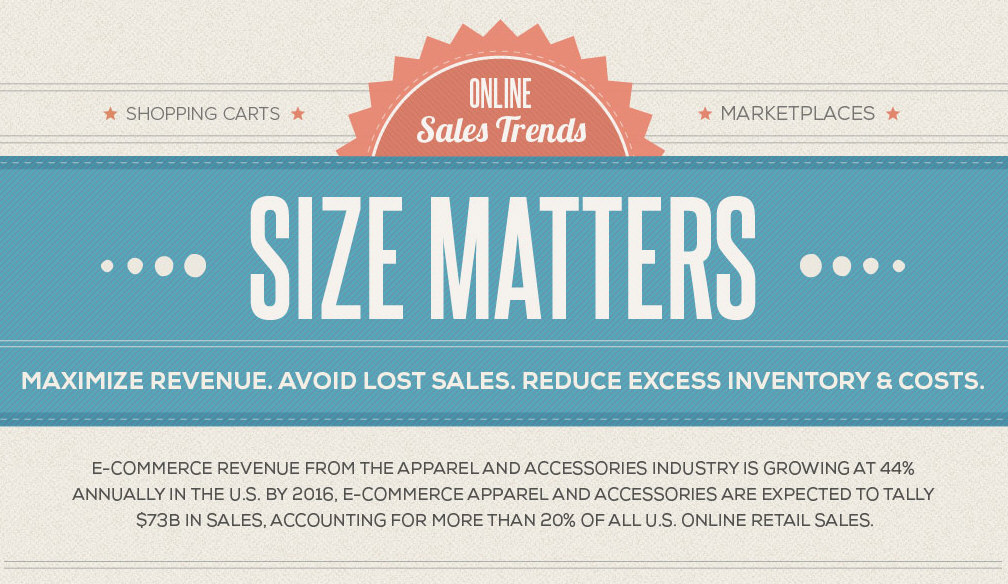
Online Sales Trends Size Matters
E-commerce revenue from the apparel and accessories industry is growing at 44% annually in the United States. By 2016, e-commerce apparel and accessories are expected to tally $73 Billion in sales, accounting for more than 20% of all U.S. online retail sales. 45 – 90% of all business expenses are a result of inventory costs. As a business owner you need to minimize costs, maximize revenue, and increase turn by making informed decisions about how many of each size to produce or carry.

13 Money-Saving Tips for 2013
How would you like to start out the New Year saving money? This infographic from Quicken Loans will show you 13 different money saving tips that will help you save a combined total of $11,244.00! These tips are simple adjustments to your daily life that will help you take control of your debt and fatten up your bank account.

Improving Your Home in 10 Minutes or Less
Decorating is a relatively inexpensive way to brighten your home. Even painting just one wall can transform a room. If you are looking for simple, ten minute tips, this chart should have just what you need.
Media Buying and the 2013 Academy Awards
This infographic, developed by Ocean Media, focuses on the business side of the awards, specifically TV ratings, ad costs, and how the Oscars compare to other live televised events.
St. Patrick’s Day Fun Facts
St. Patrick’s Day is a celebration of Irish culture and of course, St. Patrick himself. Learn some fun facts about this holiday with this infographic brought to you by Ink Pixi.
Social MEowDia Explained
While social media might be second nature to tech savvy marketers of the world, it’s a fully foreign language to others. In fact, even those that feel they have a solid understanding of the platform are often blind-sided by some of the totally new social sites that seem to be popping up left and right. Well, with that, Avalaunch Media explain exactly what social media is and how the various sites each offer their own take on the technology in the following infographic.

The Age-Old Battle: Star Wars vs. Star Trek
The battle wages on – that is between two of sci-fi’s most iconic franchises, Star Trek and Star Wars. It is s a battle that has been discussed by fans for over 30 years now. And with the recent news of J.J. Abrams accepting the director’s job on the next Star Wars film, the flames have been fanned.
Leveraging Behemoths
What is the difference between Standard Web Retargeting and Facebook Exchange? Should advertisers put all of their eggs in one basket with either one? Check out the infographic below from AdRoll to learn more about both forms of retargeting.
How Twitter Saw The Oscars 2013
Nothing sparks a Twitter storm like well-dressed A-listers at an awards ceremony. Of course staying up for the Oscars for those in the UK takes a whole lot of commitment, that’s why Silverbean took the easy route and turned to Twitter. Here is their handy guide to what you missed online and IRL.
And the Oscar For the Furthest Traveled Goes To…
The following infographic from Insure&Away Travel Insurance shows information about how far the Oscar nominees had to travel to get to the 2013 Oscars. The results may surprise you.
Online Sales Trends Size Matters
E-commerce revenue from the apparel and accessories industry is growing at 44% annually in the United States. By 2016, e-commerce apparel and accessories are expected to tally $73 Billion in sales, accounting for more than 20% of all U.S. online retail sales. 45 – 90% of all business expenses are a result of inventory costs. As a business owner you need to minimize costs, maximize revenue, and increase turn by making informed decisions about how many of each size to produce or carry.
13 Money-Saving Tips for 2013
How would you like to start out the New Year saving money? This infographic from Quicken Loans will show you 13 different money saving tips that will help you save a combined total of $11,244.00! These tips are simple adjustments to your daily life that will help you take control of your debt and fatten up your bank account.
Improving Your Home in 10 Minutes or Less
Decorating is a relatively inexpensive way to brighten your home. Even painting just one wall can transform a room. If you are looking for simple, ten minute tips, this chart should have just what you need.
Media Buying and the 2013 Academy Awards
This infographic, developed by Ocean Media, focuses on the business side of the awards, specifically TV ratings, ad costs, and how the Oscars compare to other live televised events.
St. Patrick’s Day Fun Facts
St. Patrick’s Day is a celebration of Irish culture and of course, St. Patrick himself. Learn some fun facts about this holiday with this infographic brought to you by Ink Pixi.
Social MEowDia Explained
While social media might be second nature to tech savvy marketers of the world, it’s a fully foreign language to others. In fact, even those that feel they have a solid understanding of the platform are often blind-sided by some of the totally new social sites that seem to be popping up left and right. Well, with that, Avalaunch Media explain exactly what social media is and how the various sites each offer their own take on the technology in the following infographic.
The Age-Old Battle: Star Wars vs. Star Trek
The battle wages on – that is between two of sci-fi’s most iconic franchises, Star Trek and Star Wars. It is s a battle that has been discussed by fans for over 30 years now. And with the recent news of J.J. Abrams accepting the director’s job on the next Star Wars film, the flames have been fanned.
Leveraging Behemoths
What is the difference between Standard Web Retargeting and Facebook Exchange? Should advertisers put all of their eggs in one basket with either one? Check out the infographic below from AdRoll to learn more about both forms of retargeting.
Partners


Browse Archives By Category
Animated Infographics
Business Infographics
Career & Jobs Infographics
Education Infographics
Entertainment Industry Infographics
Environmental Infographics
Finance & Money Infographics
Food & Drink Infographics
Health Infographics
Historical Infographics
Home & Garden Infographics
Internet Infographics
Law and Legal Infographics
Lifestyle Infographics
Marketing Infographics
Offbeat Infographics
Parenting Infographics
Pets & Animals Infographics
Political Infographics
Shopping Infographics
Sports and Athletic Infographics
Technology Infographics
Transportation Infographics
Travel Infographics
Video Infographics