


Search 12,100+ Infographics!
Marijuana in America
There are 2.5 million registered users of medical marijuana in the United States. Check out the following infographic from InsuranceQuotes.com to learn more interesting facts about marijuana in America.

HTML 5: Gateway To HTML.next
HTML5 is big news – and it’s not surprising. It’s a major step forward in web design, bringing unprecedented capabilities and flexibility to the way sites are put together. It’s set to make a significant difference to the way brands develop their digital strategies and marketing plans – one which has the potential to enhance digital commerce and engagement, at a time when ecommerce and online retail is going from strength to strength.
Feel The Burn in 10 Minutes
Do you know how many calories you use up just by sitting for 10 minutes? Did you know your body is better at consuming calories than burning them? Read this fun infographic for more calorific information.

Top 10 Time Killers
We all waste time, emailing, chatting or surfing the internet. This infographic from OfficeTime.net shows the top 10 ways we kill time every day. Follow the flow chart and see how you can change the way you work.
Five Ways Americans are Bullied by the Government
Are we being bullied by the government? From controlling the internet to armed drones, it sure looks like the government might be trying to control us. This infographic takes a look at five ways the government bullies Americans.
Rise of the Angel Investor
The number of angel Investors and the amount of of dollars they’ve invested have significantly increased over the last ten years, allowing aspiring entrepreneurs more opportunities than ever to achieve success for their early stage companies. This infographic visualizes this significant increase in angel investors and invested dollars in the last decade.
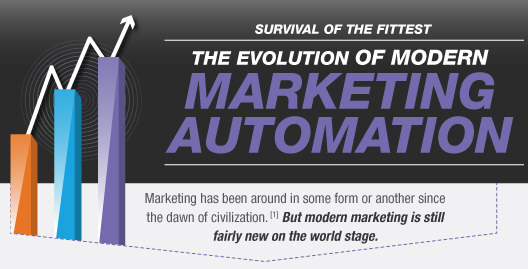
The Evolution of Modern Marketing Automation
This infographic from Marketo provides a visual interpretation of the evolution of modern marketing. Learn how advances in radio, television, the internet, social media, and the arrival of marketing automation technology has paved the way for modern marketing as we know it today.
More Than Money: The Human Side of Business
Typically when we think of business we think of money. However, there is a lot more to business than just money. This infographic takes a look at the human side of business which includes employers, environment, and humanity. Check it out below to learn more.
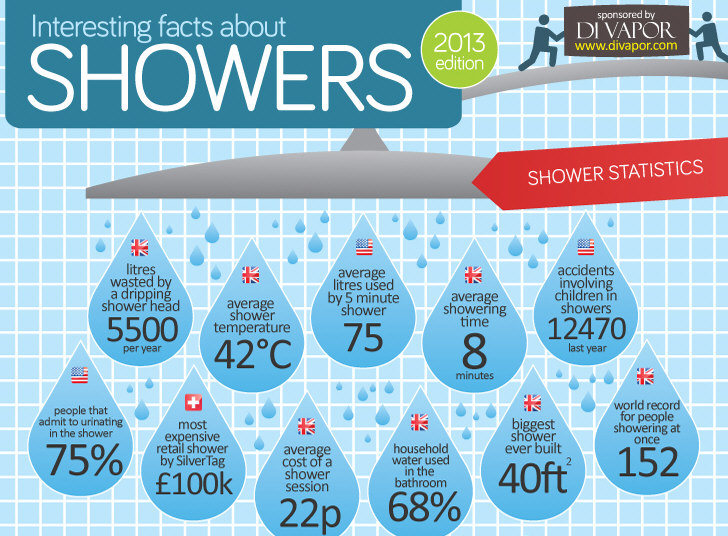
Interesting Facts About Showers
That’s right, according to official statistics; Mexico tops the list of countries that shower the most. Close to 90% of Mexicans shower every single day, compared to approximately 70% of Americans. Does this mean Americans aren’t as hygienic as Mexicans, or does it mean Americans think about the environment more than Mexicans? Second on the list is Australia, followed by France, USA, UK, Russia, Sweden, Germany and then China. Just 25% of Chinese men shower every day.
Celebrating the Battery
Just imagine where the world would be without batteries! Having three grandkids and toys abounding, I always keep an ample supply of these power sources. With the recent “National Battery Day,” Batteries Plus has created an infographic for the event which provides some useful and historical data about batteries.
Marijuana in America
There are 2.5 million registered users of medical marijuana in the United States. Check out the following infographic from InsuranceQuotes.com to learn more interesting facts about marijuana in America.
HTML 5: Gateway To HTML.next
HTML5 is big news – and it’s not surprising. It’s a major step forward in web design, bringing unprecedented capabilities and flexibility to the way sites are put together. It’s set to make a significant difference to the way brands develop their digital strategies and marketing plans – one which has the potential to enhance digital commerce and engagement, at a time when ecommerce and online retail is going from strength to strength.
Feel The Burn in 10 Minutes
Do you know how many calories you use up just by sitting for 10 minutes? Did you know your body is better at consuming calories than burning them? Read this fun infographic for more calorific information.
Top 10 Time Killers
We all waste time, emailing, chatting or surfing the internet. This infographic from OfficeTime.net shows the top 10 ways we kill time every day. Follow the flow chart and see how you can change the way you work.
Five Ways Americans are Bullied by the Government
Are we being bullied by the government? From controlling the internet to armed drones, it sure looks like the government might be trying to control us. This infographic takes a look at five ways the government bullies Americans.
Rise of the Angel Investor
The number of angel Investors and the amount of of dollars they’ve invested have significantly increased over the last ten years, allowing aspiring entrepreneurs more opportunities than ever to achieve success for their early stage companies. This infographic visualizes this significant increase in angel investors and invested dollars in the last decade.
The Evolution of Modern Marketing Automation
This infographic from Marketo provides a visual interpretation of the evolution of modern marketing. Learn how advances in radio, television, the internet, social media, and the arrival of marketing automation technology has paved the way for modern marketing as we know it today.
More Than Money: The Human Side of Business
Typically when we think of business we think of money. However, there is a lot more to business than just money. This infographic takes a look at the human side of business which includes employers, environment, and humanity. Check it out below to learn more.
Interesting Facts About Showers
That’s right, according to official statistics; Mexico tops the list of countries that shower the most. Close to 90% of Mexicans shower every single day, compared to approximately 70% of Americans. Does this mean Americans aren’t as hygienic as Mexicans, or does it mean Americans think about the environment more than Mexicans? Second on the list is Australia, followed by France, USA, UK, Russia, Sweden, Germany and then China. Just 25% of Chinese men shower every day.
Celebrating the Battery
Just imagine where the world would be without batteries! Having three grandkids and toys abounding, I always keep an ample supply of these power sources. With the recent “National Battery Day,” Batteries Plus has created an infographic for the event which provides some useful and historical data about batteries.
Partners


Browse Archives By Category
Animated Infographics
Business Infographics
Career & Jobs Infographics
Education Infographics
Entertainment Industry Infographics
Environmental Infographics
Finance & Money Infographics
Food & Drink Infographics
Health Infographics
Historical Infographics
Home & Garden Infographics
Internet Infographics
Law and Legal Infographics
Lifestyle Infographics
Marketing Infographics
Offbeat Infographics
Parenting Infographics
Pets & Animals Infographics
Political Infographics
Shopping Infographics
Sports and Athletic Infographics
Technology Infographics
Transportation Infographics
Travel Infographics
Video Infographics