Search 12,000+ Infographics!
The Fundamentals of Inbound Marketing
Inbound marketing has been added to a lot of people’s vocabulary lately. Why? Because it encompasses what every business needs to survive: real marketing. This infographic takes a look into the what, who, why, when, how, and where of inbound marketing.
The Psychology of an Internet Troll
An Internet troll is no normal person – they think differently than most of us. This infographic takes a look at the psychology of the mysterious creature, otherwise known as the Internet troll. Check it out below to learn more.
The Cost of Exploring Space: Film vs. Reality
When the first sci-fi film was shown in 1902 it stirred the public’s interest in space exploration. As very few of us will qualify to become astronauts we can still enjoy space travel through the mediums of cinema and television. This infographic looks at the costs involved and compare science fiction to science fact.
10 Common Diet Traps and How You Can Avoid Them
Did you know you’re 43% less likely to become obese if you eat breakfast? Keeping fit and losing weight can be difficult, so make sure you’re doing it right! Avoid these 10 most common dieting traps provided by Waitrose along with stats to help you diet well.
The Science of Smart
Intelligence, from a scientific perspective, is a broad and deep comprehension of our surroundings – “catching on,” “making sense” of things, or “figuring out” what to do. Check out the infographic below presented by BestCollegeReviews to learn more about the science of smart.
Needs of Pure Water
The only way to really understand and appreciate the importance of water to our lives is to look at some vital information about water needs. The following infographic covers this topic in visual detail.
The Ultimate Guide to Dr. Who
Love Dr. Who? Like to know more about all the doctors, companions, foes, and battles for each show? Then you’re in the right place as this infographic is an ultimate guide to all things Dr. Who.
Resolution Reboot: Don’t Be That Statistic
WalkJogRun shows how runners need to make a habit to run through February to make sure they have a successful year running. Data was collected from 2012 on WalkJogRun runners logging “run” training sessions in January 2012. For example, 4,000 runners started January 2013 running. 75% of runners who skip February won’t run again this year. Don’t be that statistic.
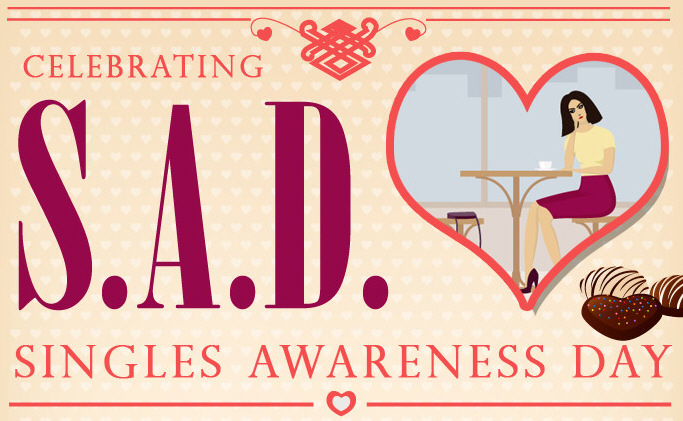
S.A.D. – Single Awareness Day
The rapidly growing population of singles in the US often gets rankled by all the obsession over Valentine’s Day. That’s where Singles Awareness Day comes in. Check out this infographic from Mrs. Fields on the origins behind the holiday, and how singles can celebrate their independence in style!
Social Super Bowl XLVII
Superbowl XLVII is now in the history books and no doubt a few memories already stick out: The Baltimore Ravens victory over the San Francisco 49ers, the 35 minute delay caused by the Superdome blackout, or maybe even the Beyonce halftime show. But how did the Superbowl fare in social media?
Partners
Browse Archives By Category
Animated Infographics
Business Infographics
Career & Jobs Infographics
Education Infographics
Entertainment Industry Infographics
Environmental Infographics
Finance & Money Infographics
Food & Drink Infographics
Health Infographics
Historical Infographics
Home & Garden Infographics
Internet Infographics
Law and Legal Infographics
Lifestyle Infographics
Marketing Infographics
Offbeat Infographics
Parenting Infographics
Pets & Animals Infographics
Political Infographics
Shopping Infographics
Sports and Athletic Infographics
Technology Infographics
Transportation Infographics
Travel Infographics
Video Infographics


