


Search 12,100+ Infographics!
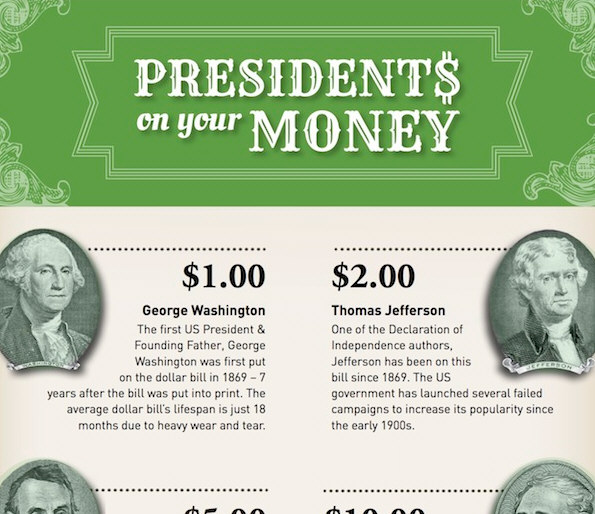
Which Presidents Are On U.S. Money?
Who’s on your money? NerdWallet put together this infographic just in time to Presidents’ Day and it breaks down which presidents are featured on U.S. currency and also shares fun facts about each denomination.

20 Facts About Headlice
Head lice, sometimes called nits, are common in children. Research shows that around 1 in 10 children in the UK are likely to get head lice at some time. Find out how to get rid of them if your child is affected in this infographic from the folks at Giraffe.ie.
The History of Honda
Based in Japan, Honda is well known for manufacturing plenty of quality, practical vehicles at a rate that just about anybody can afford. Just after World War II came the first endeavors by Honda, and the small-time effort quickly grew into a major success in terms of both automobiles and motorcycle. In order to better appreciate exactly what the company has been able to accomplish in such a short period of time, consider looking through the lengthy history that Honda has created for itself in the following infographic.
10 Biggest Verdicts of 2012
In 2012, there were some massive verdicts. The top 3 consisted of patent infringement litigation, and each of these 3 verdicts exceeded $1 billion. There were also several medical malpractice verdicts that occupied the top ten. Learn all about them in the following infographic from RD Legal Funding.

Managing the Risks of an Extended Workforce
The new norm in staffing is officially here. It’s the extended workforce and it makes up more than one-quarter of the total workforce population in today’s organizations—more than twice the percentage from 2005. This infographic summarizes tips for employers on managing the risks and reaping the rewards of a contingent workforce.
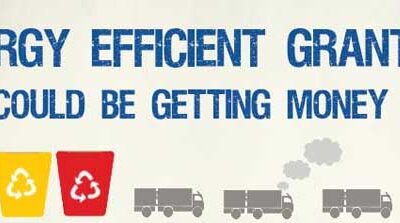
Energy Efficiency Tax Rebates
Want to learn how to cut your tax bill? Who doesn’t want to save money on their taxes due! This infographic describes how homeowners and businesses can receive tax rebates and save money by purchasing energy-efficient devices for their homes.

Top 9 Things to Do After a Car Accident
After a car accident, drivers may become flustered, or worse injured. For that reason, it is important to be aware of the important steps to make after an accident on the road. The law firm of Reeves, Aiken & Hightower LLP has created this infographic that outlines the top 9 things to do after a car accident. These steps include seeking medical attention, calling the police, collecting information from other drivers involved and taking pictures.
Nurturing Religion Within the Household
The preservation of faith is often revered as a key, fundamental element in the lives of many. As a whole, an implemented belief system is intended to foster spiritual guidance whilst providing a strong sense of community for the the bevy of religions that are routinely observed. Most Americans consider themselves people of faith, but these spiritual beliefs span various, religious spectrums.
The Real Cost of Checking Your Golf Bag
You might be surprised about the current cost associated with shipping your golf clubs. All of the people you have to tip to carry your bags, all of the times you have to carry your bags yourself, and the costs of shipping your bags from one course to another. This is an infographic that was created to provide you with a baseline of how much money you could be losing by shipping your golf bags through a common carrier .
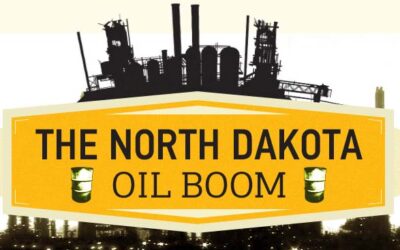
The North Dakota Oil Boom
North Dakota oil is booming, and business has never been better. But costs are rising, and many of those businesses in the oil industry are losing funds. Learn how accounts receivables factoring allows those businesses to stay afloat and thrive as costs rise in the following infographic.
Which Presidents Are On U.S. Money?
Who’s on your money? NerdWallet put together this infographic just in time to Presidents’ Day and it breaks down which presidents are featured on U.S. currency and also shares fun facts about each denomination.
20 Facts About Headlice
Head lice, sometimes called nits, are common in children. Research shows that around 1 in 10 children in the UK are likely to get head lice at some time. Find out how to get rid of them if your child is affected in this infographic from the folks at Giraffe.ie.
The History of Honda
Based in Japan, Honda is well known for manufacturing plenty of quality, practical vehicles at a rate that just about anybody can afford. Just after World War II came the first endeavors by Honda, and the small-time effort quickly grew into a major success in terms of both automobiles and motorcycle. In order to better appreciate exactly what the company has been able to accomplish in such a short period of time, consider looking through the lengthy history that Honda has created for itself in the following infographic.
10 Biggest Verdicts of 2012
In 2012, there were some massive verdicts. The top 3 consisted of patent infringement litigation, and each of these 3 verdicts exceeded $1 billion. There were also several medical malpractice verdicts that occupied the top ten. Learn all about them in the following infographic from RD Legal Funding.
Managing the Risks of an Extended Workforce
The new norm in staffing is officially here. It’s the extended workforce and it makes up more than one-quarter of the total workforce population in today’s organizations—more than twice the percentage from 2005. This infographic summarizes tips for employers on managing the risks and reaping the rewards of a contingent workforce.
Energy Efficiency Tax Rebates
Want to learn how to cut your tax bill? Who doesn’t want to save money on their taxes due! This infographic describes how homeowners and businesses can receive tax rebates and save money by purchasing energy-efficient devices for their homes.
Top 9 Things to Do After a Car Accident
After a car accident, drivers may become flustered, or worse injured. For that reason, it is important to be aware of the important steps to make after an accident on the road. The law firm of Reeves, Aiken & Hightower LLP has created this infographic that outlines the top 9 things to do after a car accident. These steps include seeking medical attention, calling the police, collecting information from other drivers involved and taking pictures.
Nurturing Religion Within the Household
The preservation of faith is often revered as a key, fundamental element in the lives of many. As a whole, an implemented belief system is intended to foster spiritual guidance whilst providing a strong sense of community for the the bevy of religions that are routinely observed. Most Americans consider themselves people of faith, but these spiritual beliefs span various, religious spectrums.
The Real Cost of Checking Your Golf Bag
You might be surprised about the current cost associated with shipping your golf clubs. All of the people you have to tip to carry your bags, all of the times you have to carry your bags yourself, and the costs of shipping your bags from one course to another. This is an infographic that was created to provide you with a baseline of how much money you could be losing by shipping your golf bags through a common carrier .
The North Dakota Oil Boom
North Dakota oil is booming, and business has never been better. But costs are rising, and many of those businesses in the oil industry are losing funds. Learn how accounts receivables factoring allows those businesses to stay afloat and thrive as costs rise in the following infographic.
Partners


Browse Archives By Category
Animated Infographics
Business Infographics
Career & Jobs Infographics
Education Infographics
Entertainment Industry Infographics
Environmental Infographics
Finance & Money Infographics
Food & Drink Infographics
Health Infographics
Historical Infographics
Home & Garden Infographics
Internet Infographics
Law and Legal Infographics
Lifestyle Infographics
Marketing Infographics
Offbeat Infographics
Parenting Infographics
Pets & Animals Infographics
Political Infographics
Shopping Infographics
Sports and Athletic Infographics
Technology Infographics
Transportation Infographics
Travel Infographics
Video Infographics