


Search 12,100+ Infographics!

The Happy Secret to Better Work
What comes first? Success? Or happiness? Author Shawn Achor reveals some interesting data in his book, “The Happiness Advantage” and this infographic from Careertopia summarizes his findings.
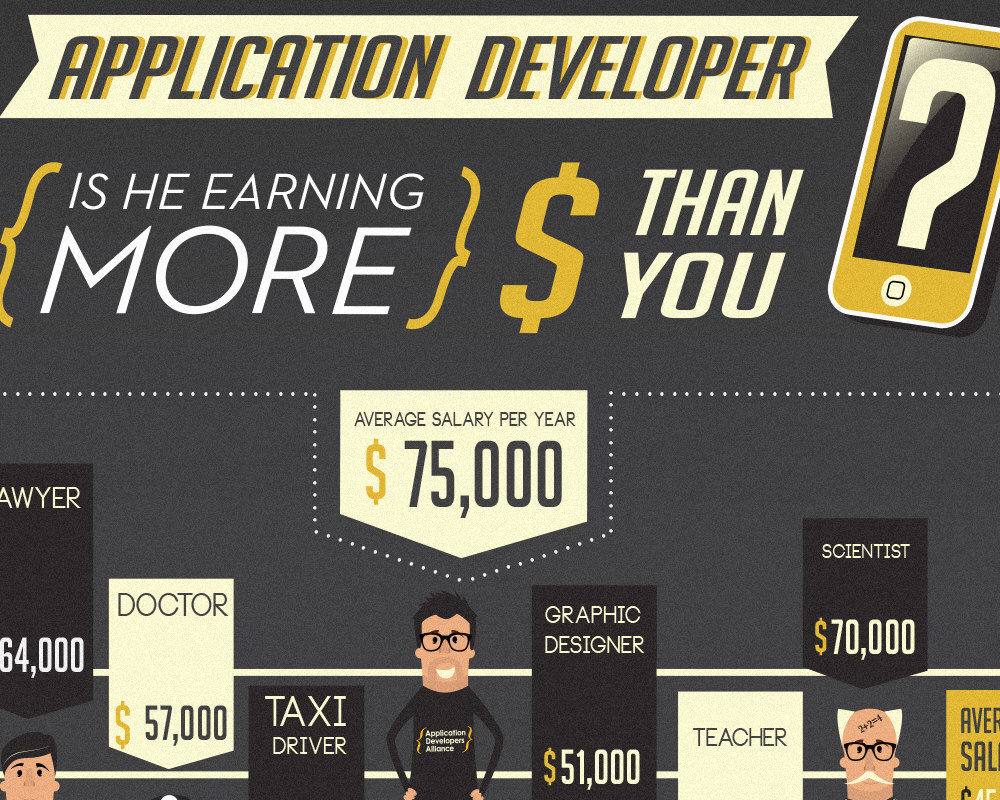
Is An Application Developer Earning More Than You?
Application development is one of the fastest growing industries in the world, and the number of app developers and their potential salaries are growing steadily. The app market itself was worth $5 billion as of 2011, with mobile application revenue estimated to reach $46 billion by 2016.
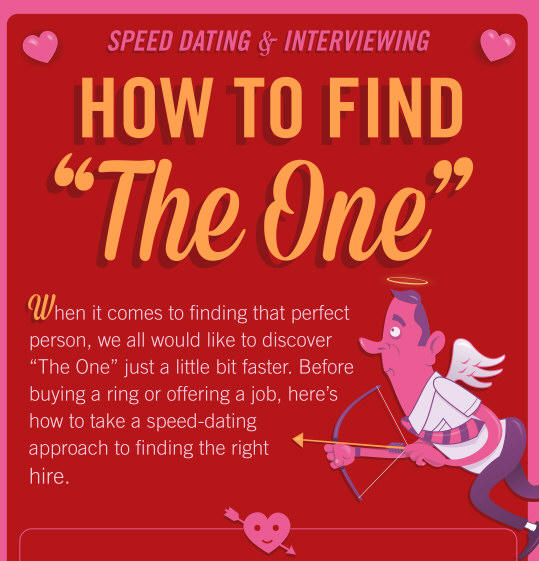
Speed Dating & Interviewing: How to Find “The One”
Speed dating and video interviewing can help those looking for romance or a great hire find “The One” more quickly. No one wants to waste time on the wrong person, whether it’s in a bad relationship or with a costly bad hire…right? The infographic below, compiled by Spark Hire, compares the search for that special someone to the hunt for your perfect hire.

Magical Maldives: A Nation In Numbers
The Maldives are renowned as paradise islands – ideal destinations for a luxury holiday or honeymoon on picture perfect beaches fringed with palm trees. Yet there is far more to this nation than tourism. Explore its geography and culture with this infographic.
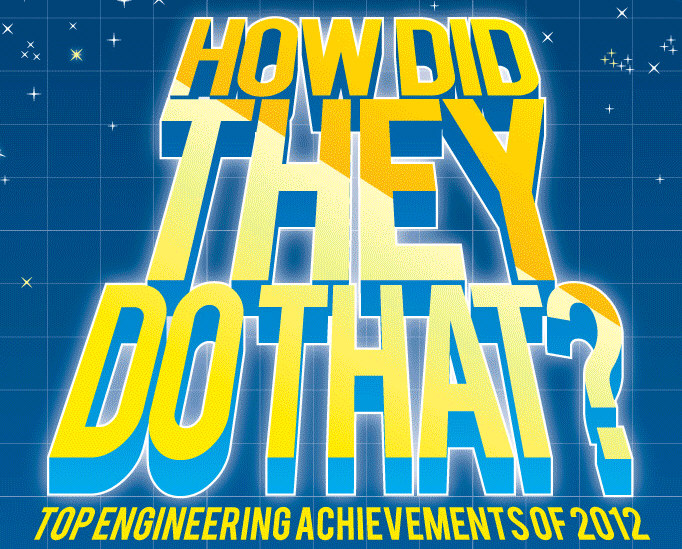
Top Engineering Achievements of 2012
As millions around the world sat glued to the stream of Felix Baumgartner jumping from the edge of space, how many of them marveled at the monumental engineering feat they were watching? Take a look at these top engineering achievements of 2012 in an infographic.
The Anatomy of a Great Resume
Having a good resume is a big part of landing the job. HR managers can receive anywhere from 50 to 100 resumes per job posting, so it’s important that your resume stands out in the crowd. Check out the infographic below to learn more about creating a note-worthy resume.
10 Valentine’s Day Tips for Ecommerce SMB Merchants
Get your romance on! February 14th is just around the corner. That means people are shopping for that “special someone” for Valentine’s Day. It’s time to go beyond chocolates and flowers to increase online sales on this important retail holiday. Below are 10 tips from Vendio you can use that will make St. Valentine proud.
The Top 20 Holiday Apps For 2013
When you’re heading off into the unknown for your next great adventure, having detailed information about where to go, what to do and what to avoid can make or break your trip. Smartphones enable us to keep all this info to hand, so HRS has rounded up the very best travel apps that will enhance your holiday of a lifetime.

How Long Should You Store Wine?
For the new wine enthusiast, the complexities of wine storage can be a bit baffling. Which wines are worth saving in the cellar, and which ones should you drink right away to enjoy their best flavors? Enjoy your favorite wines at the peak of flavor by following these guidelines from NewAir.com for wine storage.

Valentine’s Day By The Numbers
Valentine’s Day is right around the corner. Will you be getting your special someone a gift? This infographic takes a look at how much will be spent this Valentine’s Day on the holiday’s most popular gifts.
The Happy Secret to Better Work
What comes first? Success? Or happiness? Author Shawn Achor reveals some interesting data in his book, “The Happiness Advantage” and this infographic from Careertopia summarizes his findings.
Is An Application Developer Earning More Than You?
Application development is one of the fastest growing industries in the world, and the number of app developers and their potential salaries are growing steadily. The app market itself was worth $5 billion as of 2011, with mobile application revenue estimated to reach $46 billion by 2016.
Speed Dating & Interviewing: How to Find “The One”
Speed dating and video interviewing can help those looking for romance or a great hire find “The One” more quickly. No one wants to waste time on the wrong person, whether it’s in a bad relationship or with a costly bad hire…right? The infographic below, compiled by Spark Hire, compares the search for that special someone to the hunt for your perfect hire.
Magical Maldives: A Nation In Numbers
The Maldives are renowned as paradise islands – ideal destinations for a luxury holiday or honeymoon on picture perfect beaches fringed with palm trees. Yet there is far more to this nation than tourism. Explore its geography and culture with this infographic.
Top Engineering Achievements of 2012
As millions around the world sat glued to the stream of Felix Baumgartner jumping from the edge of space, how many of them marveled at the monumental engineering feat they were watching? Take a look at these top engineering achievements of 2012 in an infographic.
The Anatomy of a Great Resume
Having a good resume is a big part of landing the job. HR managers can receive anywhere from 50 to 100 resumes per job posting, so it’s important that your resume stands out in the crowd. Check out the infographic below to learn more about creating a note-worthy resume.
10 Valentine’s Day Tips for Ecommerce SMB Merchants
Get your romance on! February 14th is just around the corner. That means people are shopping for that “special someone” for Valentine’s Day. It’s time to go beyond chocolates and flowers to increase online sales on this important retail holiday. Below are 10 tips from Vendio you can use that will make St. Valentine proud.
The Top 20 Holiday Apps For 2013
When you’re heading off into the unknown for your next great adventure, having detailed information about where to go, what to do and what to avoid can make or break your trip. Smartphones enable us to keep all this info to hand, so HRS has rounded up the very best travel apps that will enhance your holiday of a lifetime.
How Long Should You Store Wine?
For the new wine enthusiast, the complexities of wine storage can be a bit baffling. Which wines are worth saving in the cellar, and which ones should you drink right away to enjoy their best flavors? Enjoy your favorite wines at the peak of flavor by following these guidelines from NewAir.com for wine storage.
Valentine’s Day By The Numbers
Valentine’s Day is right around the corner. Will you be getting your special someone a gift? This infographic takes a look at how much will be spent this Valentine’s Day on the holiday’s most popular gifts.
Partners


Browse Archives By Category
Animated Infographics
Business Infographics
Career & Jobs Infographics
Education Infographics
Entertainment Industry Infographics
Environmental Infographics
Finance & Money Infographics
Food & Drink Infographics
Health Infographics
Historical Infographics
Home & Garden Infographics
Internet Infographics
Law and Legal Infographics
Lifestyle Infographics
Marketing Infographics
Offbeat Infographics
Parenting Infographics
Pets & Animals Infographics
Political Infographics
Shopping Infographics
Sports and Athletic Infographics
Technology Infographics
Transportation Infographics
Travel Infographics
Video Infographics