


Search 12,100+ Infographics!

The Real Cost of Home Repairs: A Smart Homeowner’s Guide
Home repairs can be costly and time-consuming. Routine maintenance can save you money in the long run and help you to enjoy a safe, healthy, and happy home environment! Read more about home maintenance services in this infographic.

10 Astounding Gig World Records
If you’re interested in the ten most amazing records ever set in the music industry, this handy infographic from the folks at StubHub is for you. Are you itching to know which band’s tours sell out the fastest? Or who attracts the biggest crowds? Maybe you’re interested in learning about the deepest ever concert.
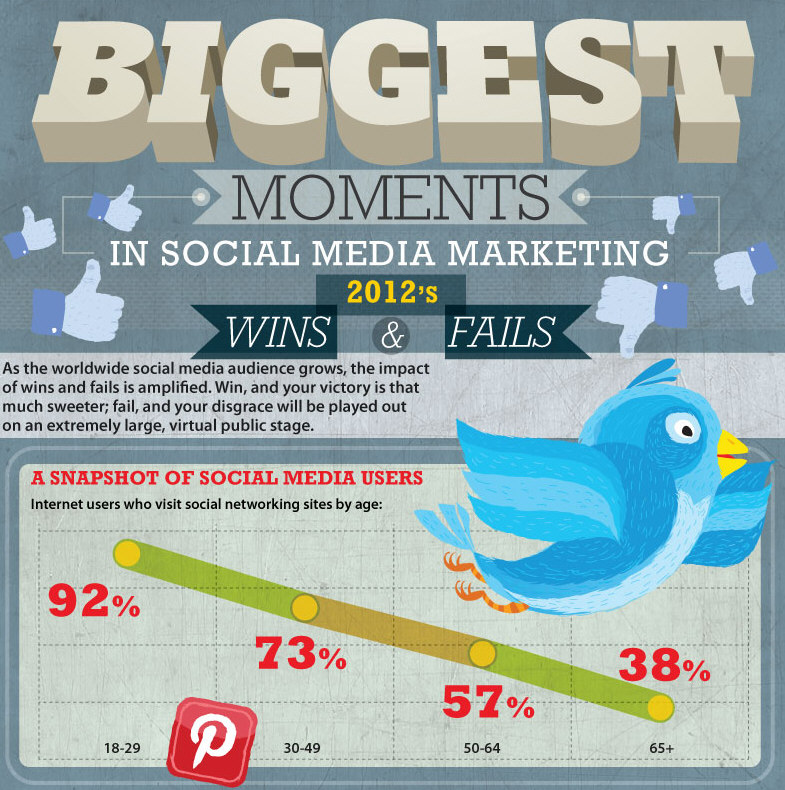
Biggest Moments in Social Media
As the worldwide social media audience grows, the impact of wins and fails is amplified. Win, and your victory is that much sweeter; fail, and your disgrace will be played out on an extremely large, virtual public stage. MBA in Marketing Guide looks at the biggest moments in social media.

Love’s Grandest Gestures
With Valentine’s Day fast approaching, Red Letter Days took a look at history’s most grandest gestures of love. Whether it’s an island or a piece of the moon – it’s hard not to feel overwhelmed by such impressive displays of affection. If you’re looking to make your own grand gesture of love this year, why not treat a loved one to a romantic weekend break? Or a hot air balloon ride?

The Race to Work
Cars aren’t at their best in snowy conditions, especially compared to winter sports athletes. Find out the average speed of nine snow sport athletes, and who would win if they raced you on your morning commute in the following infographic from Nationwide Insurance.
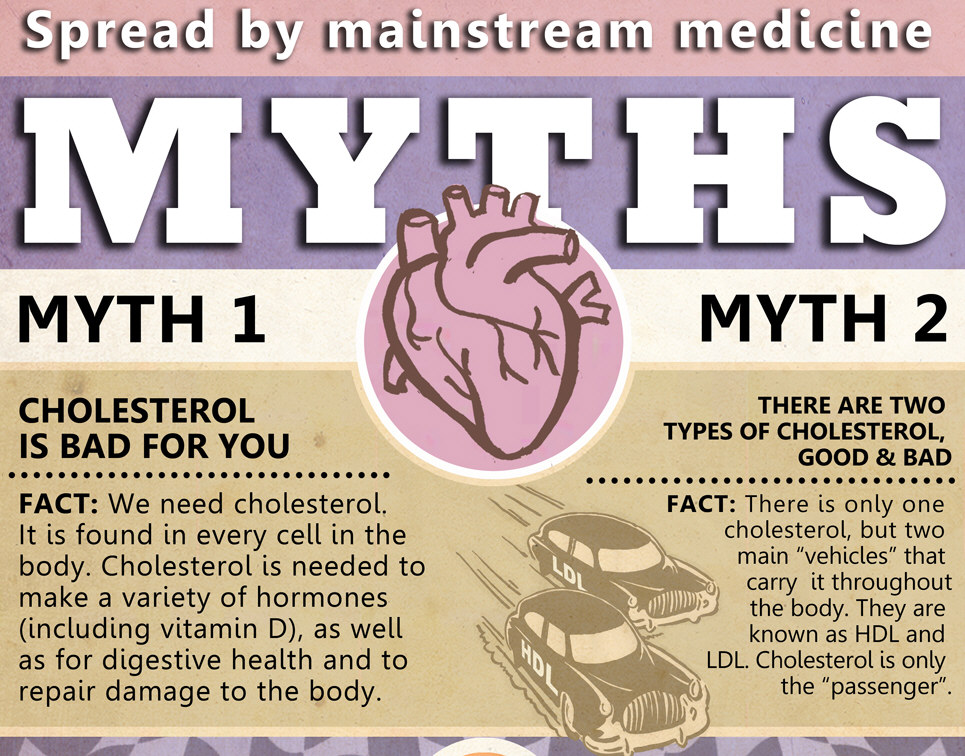
2 Myths Spread by Modern Medicine
ReNew Life created this infographic to coincide with an upcoming TV special in which a health expert, Brenda Watson, explains certain medical myths regarding cholesterol and other heart health related issues. The show, entitled “Heart of Perfect Health”, will broadcast this spring on public television though out the U.S.
Born in the USA: Pregnancy Facts
Did you know that Americans use 27.4 billion disposable diapers every year? Check out the infographic below presented by InsuranceQuotes to learn more interesting facts about pregnancy in the United States.

Ultimate Guide to Monitoring Your Online Reputation
Monitoring your online reputation can be a tricky endeavor. I mean, not only does one have to worry about search results but what about the countless social media properties, review sites and even blogs? It is a task that can get overwhelming very quickly.
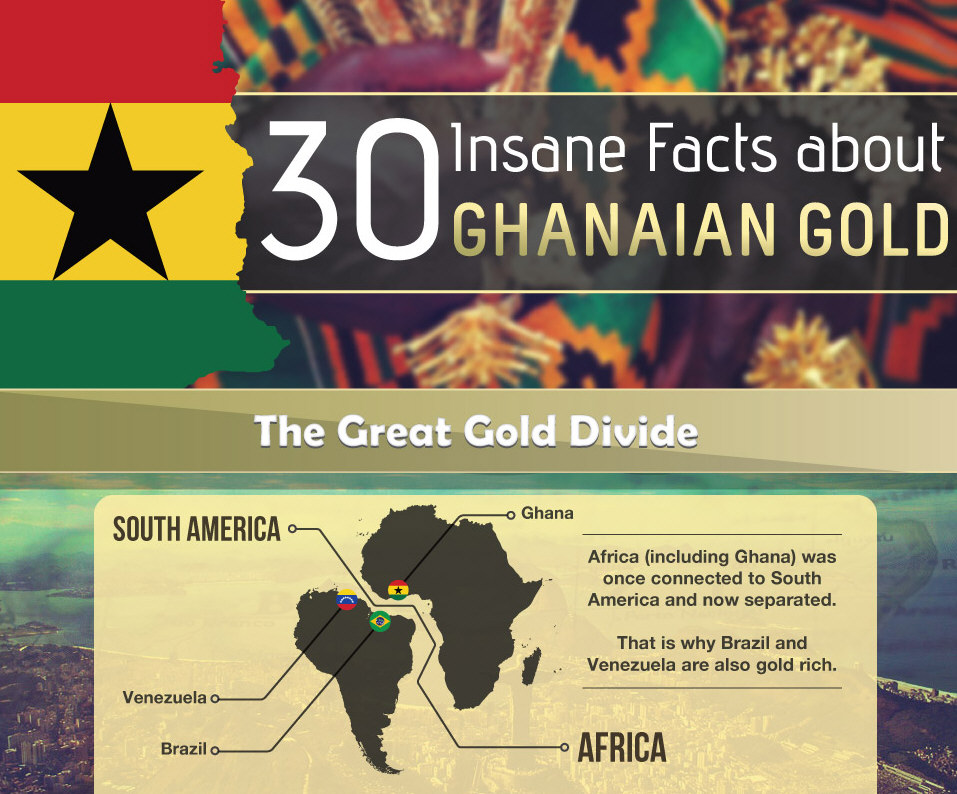
30 Insane Facts About Ghanaian Gold
Whilst Ghana’s economy is enjoying a boom due to the modern day gold rush, the mining industry has had a significant impact on the environment. Local workers, known as galamseys, use mercury during ore processing. This pollutes the land and water and results in serious illness for the workers. Learn this and other insane facts about Ghanaian gold in the following infographic by 911 Metalurgist.
The Evolution of Content Consumption
The way people consume content on the internet is always changing. Some of the biggest changes over time have been when it comes to music and video. Check out the infographic below presented by Torchbrowser to see how content consumption has evolved over the years.
The Real Cost of Home Repairs: A Smart Homeowner’s Guide
Home repairs can be costly and time-consuming. Routine maintenance can save you money in the long run and help you to enjoy a safe, healthy, and happy home environment! Read more about home maintenance services in this infographic.
10 Astounding Gig World Records
If you’re interested in the ten most amazing records ever set in the music industry, this handy infographic from the folks at StubHub is for you. Are you itching to know which band’s tours sell out the fastest? Or who attracts the biggest crowds? Maybe you’re interested in learning about the deepest ever concert.
Biggest Moments in Social Media
As the worldwide social media audience grows, the impact of wins and fails is amplified. Win, and your victory is that much sweeter; fail, and your disgrace will be played out on an extremely large, virtual public stage. MBA in Marketing Guide looks at the biggest moments in social media.
Love’s Grandest Gestures
With Valentine’s Day fast approaching, Red Letter Days took a look at history’s most grandest gestures of love. Whether it’s an island or a piece of the moon – it’s hard not to feel overwhelmed by such impressive displays of affection. If you’re looking to make your own grand gesture of love this year, why not treat a loved one to a romantic weekend break? Or a hot air balloon ride?
The Race to Work
Cars aren’t at their best in snowy conditions, especially compared to winter sports athletes. Find out the average speed of nine snow sport athletes, and who would win if they raced you on your morning commute in the following infographic from Nationwide Insurance.
2 Myths Spread by Modern Medicine
ReNew Life created this infographic to coincide with an upcoming TV special in which a health expert, Brenda Watson, explains certain medical myths regarding cholesterol and other heart health related issues. The show, entitled “Heart of Perfect Health”, will broadcast this spring on public television though out the U.S.
Born in the USA: Pregnancy Facts
Did you know that Americans use 27.4 billion disposable diapers every year? Check out the infographic below presented by InsuranceQuotes to learn more interesting facts about pregnancy in the United States.
Ultimate Guide to Monitoring Your Online Reputation
Monitoring your online reputation can be a tricky endeavor. I mean, not only does one have to worry about search results but what about the countless social media properties, review sites and even blogs? It is a task that can get overwhelming very quickly.
30 Insane Facts About Ghanaian Gold
Whilst Ghana’s economy is enjoying a boom due to the modern day gold rush, the mining industry has had a significant impact on the environment. Local workers, known as galamseys, use mercury during ore processing. This pollutes the land and water and results in serious illness for the workers. Learn this and other insane facts about Ghanaian gold in the following infographic by 911 Metalurgist.
The Evolution of Content Consumption
The way people consume content on the internet is always changing. Some of the biggest changes over time have been when it comes to music and video. Check out the infographic below presented by Torchbrowser to see how content consumption has evolved over the years.
Partners


Browse Archives By Category
Animated Infographics
Business Infographics
Career & Jobs Infographics
Education Infographics
Entertainment Industry Infographics
Environmental Infographics
Finance & Money Infographics
Food & Drink Infographics
Health Infographics
Historical Infographics
Home & Garden Infographics
Internet Infographics
Law and Legal Infographics
Lifestyle Infographics
Marketing Infographics
Offbeat Infographics
Parenting Infographics
Pets & Animals Infographics
Political Infographics
Shopping Infographics
Sports and Athletic Infographics
Technology Infographics
Transportation Infographics
Travel Infographics
Video Infographics