


Search 12,100+ Infographics!
Resolution Reboot: Don’t Be That Statistic
WalkJogRun shows how runners need to make a habit to run through February to make sure they have a successful year running. Data was collected from 2012 on WalkJogRun runners logging “run” training sessions in January 2012. For example, 4,000 runners started January 2013 running. 75% of runners who skip February won’t run again this year. Don’t be that statistic.
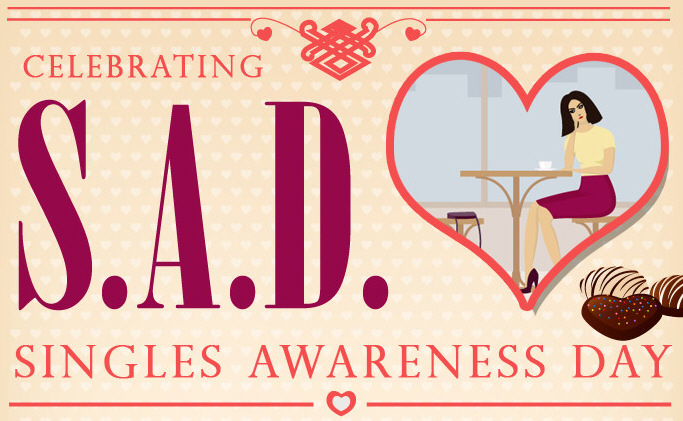
S.A.D. – Single Awareness Day
The rapidly growing population of singles in the US often gets rankled by all the obsession over Valentine’s Day. That’s where Singles Awareness Day comes in. Check out this infographic from Mrs. Fields on the origins behind the holiday, and how singles can celebrate their independence in style!
Social Super Bowl XLVII
Superbowl XLVII is now in the history books and no doubt a few memories already stick out: The Baltimore Ravens victory over the San Francisco 49ers, the 35 minute delay caused by the Superdome blackout, or maybe even the Beyonce halftime show. But how did the Superbowl fare in social media?

10 Cheap Valentine’s Day Dates
This infographic dives into the financial aspects of Valentine’s Day and comes up with some money-related facts. For instance, last year, the average person who celebrated the holiday spent $126.03. The entire country spent a combined total of $17.6 billion! But fear not as they’ve also compiled a list of 10 cheap date ideas for you to consider. Hopefully these suggestions will keep your costs down and allow you to enjoy your holiday while retaining some of that money for future dates.
The Basics of Juicing
Juicing has become a major trend and more and more people are buying juice extractors to make their own juice for healthy benefits. This infographic from Hamilton Beach has some basic information about juicing and just how many people are into this trend.
Custom Hairstyles For Your Face Shape
Stop stressing about getting a new look. LUXHAIR has done all the hard work for you. This easy to use infographic will show you what hairstyles look best for your features. All of these high fashion hairstyles were hand picked from each of the NOW, HOW, and WOW collections of women’s wigs. They were chosen based on how they complimented certain aspects of their corresponding face shape.
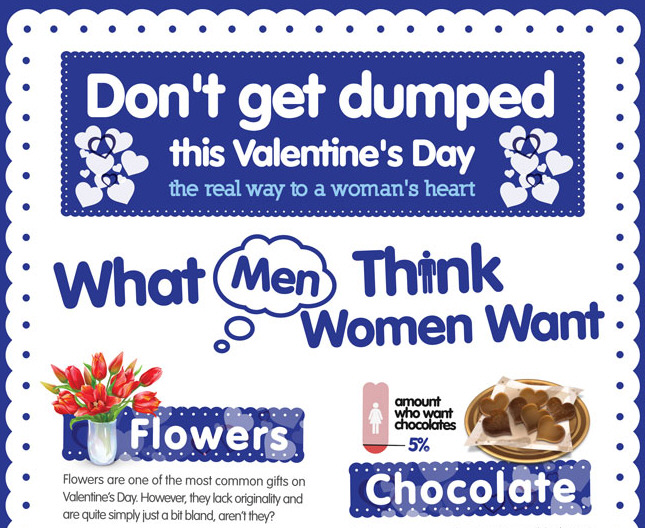
Don’t Get Dumped This Valentine’s Day – The Real Way To A Woman’s Heart
Ever wondered what the perfect gift for your female partner is on Valentine’s Day? Never know what to buy your loved one? Lacking ideas or any type of imagination? The following infographic aims to perfectly detail the common mistakes that men make when choosing Valentine’s Day gifts and suggests what could really be the key to impressing the other half.
The Marketing Super Bowl
A football team and marketing team have more in common than you might think. This infographic presented takes a look at how the Super Bowl team mates relate to different marketing strategies.
Countdown of Life: How Much Time Do You Really Have Left?
We know roughly how we spend our days – 8 hours at work, maybe half an hour in traffic, a few hours watching TV in the evening. Looking at it from a different perspective – how do you spend your time over the course of your whole life? The most shocking find was that Americans spend 9 years in front of the TV. It makes you think about how you spend your time. Are you giving time to the things you really care about?

OxyContin – The Killer Addiction
OxyContin is a prescription drug that has become one of the most abused legally obtainable drugs in the US. The addictive substance in Oxycontin is called oxycodone, which is an opiate pulled from poppy plants. In fear of people crushing the pills to make them easier to take, pharmacies placed a warning on the label that this should not be done. Unfortunately, this had the opposite effect; curious people who curiously crushed the pills often became addicted because of the tremendous high that’s obtained in powder form.
Resolution Reboot: Don’t Be That Statistic
WalkJogRun shows how runners need to make a habit to run through February to make sure they have a successful year running. Data was collected from 2012 on WalkJogRun runners logging “run” training sessions in January 2012. For example, 4,000 runners started January 2013 running. 75% of runners who skip February won’t run again this year. Don’t be that statistic.
S.A.D. – Single Awareness Day
The rapidly growing population of singles in the US often gets rankled by all the obsession over Valentine’s Day. That’s where Singles Awareness Day comes in. Check out this infographic from Mrs. Fields on the origins behind the holiday, and how singles can celebrate their independence in style!
Social Super Bowl XLVII
Superbowl XLVII is now in the history books and no doubt a few memories already stick out: The Baltimore Ravens victory over the San Francisco 49ers, the 35 minute delay caused by the Superdome blackout, or maybe even the Beyonce halftime show. But how did the Superbowl fare in social media?
10 Cheap Valentine’s Day Dates
This infographic dives into the financial aspects of Valentine’s Day and comes up with some money-related facts. For instance, last year, the average person who celebrated the holiday spent $126.03. The entire country spent a combined total of $17.6 billion! But fear not as they’ve also compiled a list of 10 cheap date ideas for you to consider. Hopefully these suggestions will keep your costs down and allow you to enjoy your holiday while retaining some of that money for future dates.
The Basics of Juicing
Juicing has become a major trend and more and more people are buying juice extractors to make their own juice for healthy benefits. This infographic from Hamilton Beach has some basic information about juicing and just how many people are into this trend.
Custom Hairstyles For Your Face Shape
Stop stressing about getting a new look. LUXHAIR has done all the hard work for you. This easy to use infographic will show you what hairstyles look best for your features. All of these high fashion hairstyles were hand picked from each of the NOW, HOW, and WOW collections of women’s wigs. They were chosen based on how they complimented certain aspects of their corresponding face shape.
Don’t Get Dumped This Valentine’s Day – The Real Way To A Woman’s Heart
Ever wondered what the perfect gift for your female partner is on Valentine’s Day? Never know what to buy your loved one? Lacking ideas or any type of imagination? The following infographic aims to perfectly detail the common mistakes that men make when choosing Valentine’s Day gifts and suggests what could really be the key to impressing the other half.
The Marketing Super Bowl
A football team and marketing team have more in common than you might think. This infographic presented takes a look at how the Super Bowl team mates relate to different marketing strategies.
Countdown of Life: How Much Time Do You Really Have Left?
We know roughly how we spend our days – 8 hours at work, maybe half an hour in traffic, a few hours watching TV in the evening. Looking at it from a different perspective – how do you spend your time over the course of your whole life? The most shocking find was that Americans spend 9 years in front of the TV. It makes you think about how you spend your time. Are you giving time to the things you really care about?
OxyContin – The Killer Addiction
OxyContin is a prescription drug that has become one of the most abused legally obtainable drugs in the US. The addictive substance in Oxycontin is called oxycodone, which is an opiate pulled from poppy plants. In fear of people crushing the pills to make them easier to take, pharmacies placed a warning on the label that this should not be done. Unfortunately, this had the opposite effect; curious people who curiously crushed the pills often became addicted because of the tremendous high that’s obtained in powder form.
Partners


Browse Archives By Category
Animated Infographics
Business Infographics
Career & Jobs Infographics
Education Infographics
Entertainment Industry Infographics
Environmental Infographics
Finance & Money Infographics
Food & Drink Infographics
Health Infographics
Historical Infographics
Home & Garden Infographics
Internet Infographics
Law and Legal Infographics
Lifestyle Infographics
Marketing Infographics
Offbeat Infographics
Parenting Infographics
Pets & Animals Infographics
Political Infographics
Shopping Infographics
Sports and Athletic Infographics
Technology Infographics
Transportation Infographics
Travel Infographics
Video Infographics