


Search 12,100+ Infographics!
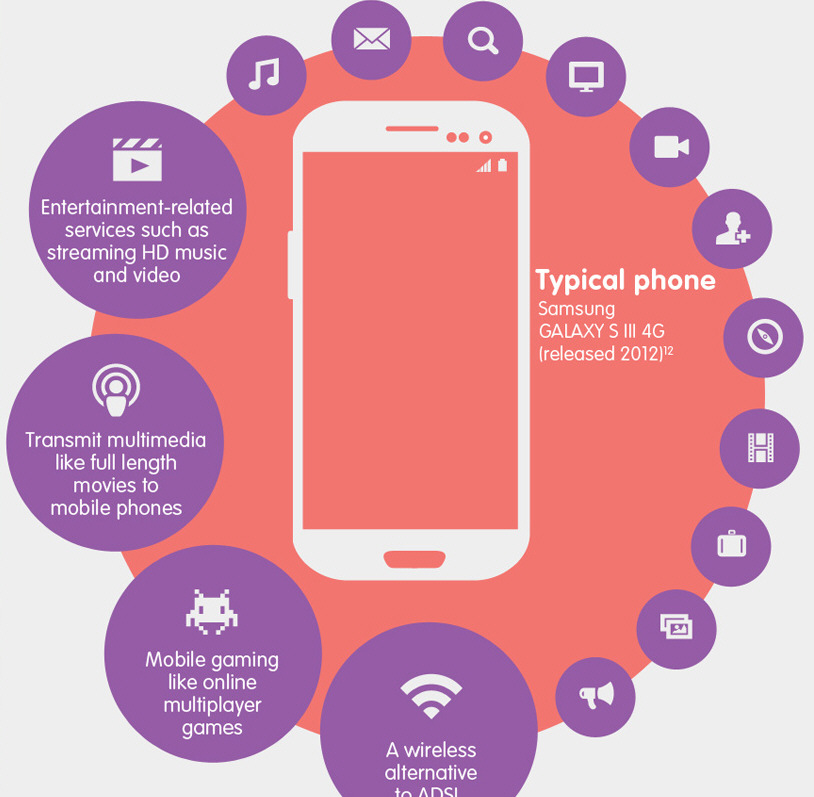
Mobile Data Usage In Australia
Do you remember the days you sent a 160-character SMS and played Snake? Well, we’ve certainly come a long way since then. This infographic reveals how much mobile broadband has grown. Discover the humble beginnings of mobile usage from budding 1G technology in the 80s all the way up to the super-awesome 4G broadband providers.
Before Choosing a College or Career…
Before choosing a college or career, make sure you are aware of the potential financial burdens and risks. Choosing the wrong path out of high school can set you back time, money, and happiness. Learn more in the following infographic.
The History Of The Garage
The modern garage is a far cry from the converted carriage house in which the first cars were housed. Over the years, garages have evolved from an external necessity to an important part of our homes. From necessary storage spaces to outright man caves, take a look at the history of the garage in the following infographic.
The Running Boom
When the U.S. won their first ever gold medal in the marathon in 1972 it sparked a huge revival for the sport of running. The competitive road race has seen a 170% increase in participation since 1991 as more people take part in more events. Fasten your running shoes and check out the following infographic that takes a look at the lighter side of this growing sport.
Google + 2012: This Is Only the Beginning
Google+ is celebrating the end of its first full calendar year as a social network and has published the following infographic that displays highlights and milestones achieved in 2012. Kind of ironic that what appears to be a growing social network ended up on this dead pool list a few days ago.
A History of Luxury Continued
Throughout history Audi has represented luxury in many countries. Car enthusiasts of all types are drawn to the elegant design and exceptional performance. Check out the infographic below to learn more about Audi luxury throughout the years.
Super Bowl Past & Present
With the Super Bowl right around the corner, emaint.com shares the following infographic which looks at the history of the Super Bowl. This is history that every football fan should know. Make sure to memorize some of these facts and quiz your friends during the big game.
How to Create Your First Infographic
Who doesn’t love a good infographic? Ever try to create one on your own? Unless you’re a Photoshop ninja, it can be a daunting process. This infographic from presents a simple 3-step guide to creating your first infographic – perfect for first-timers whether they have a huge budget or no budget at all.
What is Digital Marketing?
This infographic looks at digital marketing, examining the online assets you can use to connect with your customers, including web sites, SEO, content creation and more.
How Dangerous is Your Home?
Your home is more dangerous than you think. From animal dander to dust mites, these home hazards can take a toll on your health. Check out this infographic from COIT to discover tips and solutions to protect your home.
Partners


Browse Archives By Category
Animated Infographics
Business Infographics
Career & Jobs Infographics
Education Infographics
Entertainment Industry Infographics
Environmental Infographics
Finance & Money Infographics
Food & Drink Infographics
Health Infographics
Historical Infographics
Home & Garden Infographics
Internet Infographics
Law and Legal Infographics
Lifestyle Infographics
Marketing Infographics
Offbeat Infographics
Parenting Infographics
Pets & Animals Infographics
Political Infographics
Shopping Infographics
Sports and Athletic Infographics
Technology Infographics
Transportation Infographics
Travel Infographics
Video Infographics